Fig. 6.
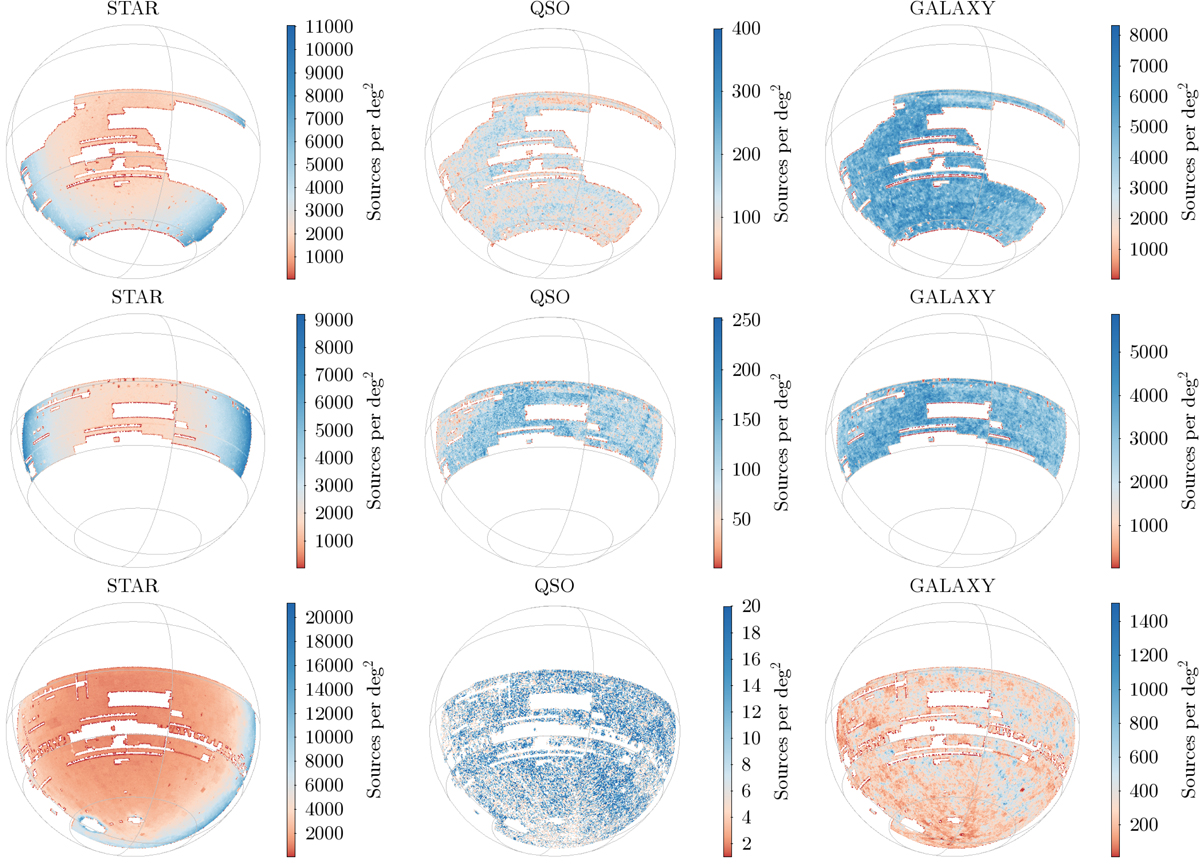
Spatial density of each class of objects in the three VEXAS tables. Top row: results obtained for VEXAS-DESW, the middle row refers to VEXAS-PSW, and the bottom row shows the results obtained for VEXAS-SMW. Towards the borders, the contribution from MW stars increases the density of STAR. For QSO and GALAXY, the non-uniform spatial distribution is mainly due to different depths reached by the surveys in that region.
Current usage metrics show cumulative count of Article Views (full-text article views including HTML views, PDF and ePub downloads, according to the available data) and Abstracts Views on Vision4Press platform.
Data correspond to usage on the plateform after 2015. The current usage metrics is available 48-96 hours after online publication and is updated daily on week days.
Initial download of the metrics may take a while.