Free Access
Fig. 5.
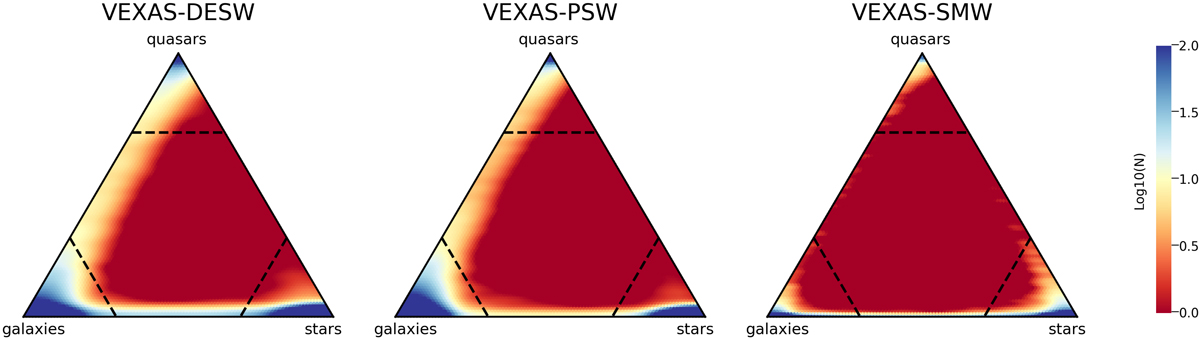
Density plot of the number of objects as a function of probability. The colour-bar indicates the log10(N) per each probability cell of size 0.01 × 0.01. The black horizontal dashed lines indicate where the threshold pclass is ≥0.7.
Current usage metrics show cumulative count of Article Views (full-text article views including HTML views, PDF and ePub downloads, according to the available data) and Abstracts Views on Vision4Press platform.
Data correspond to usage on the plateform after 2015. The current usage metrics is available 48-96 hours after online publication and is updated daily on week days.
Initial download of the metrics may take a while.