Fig. B.1.
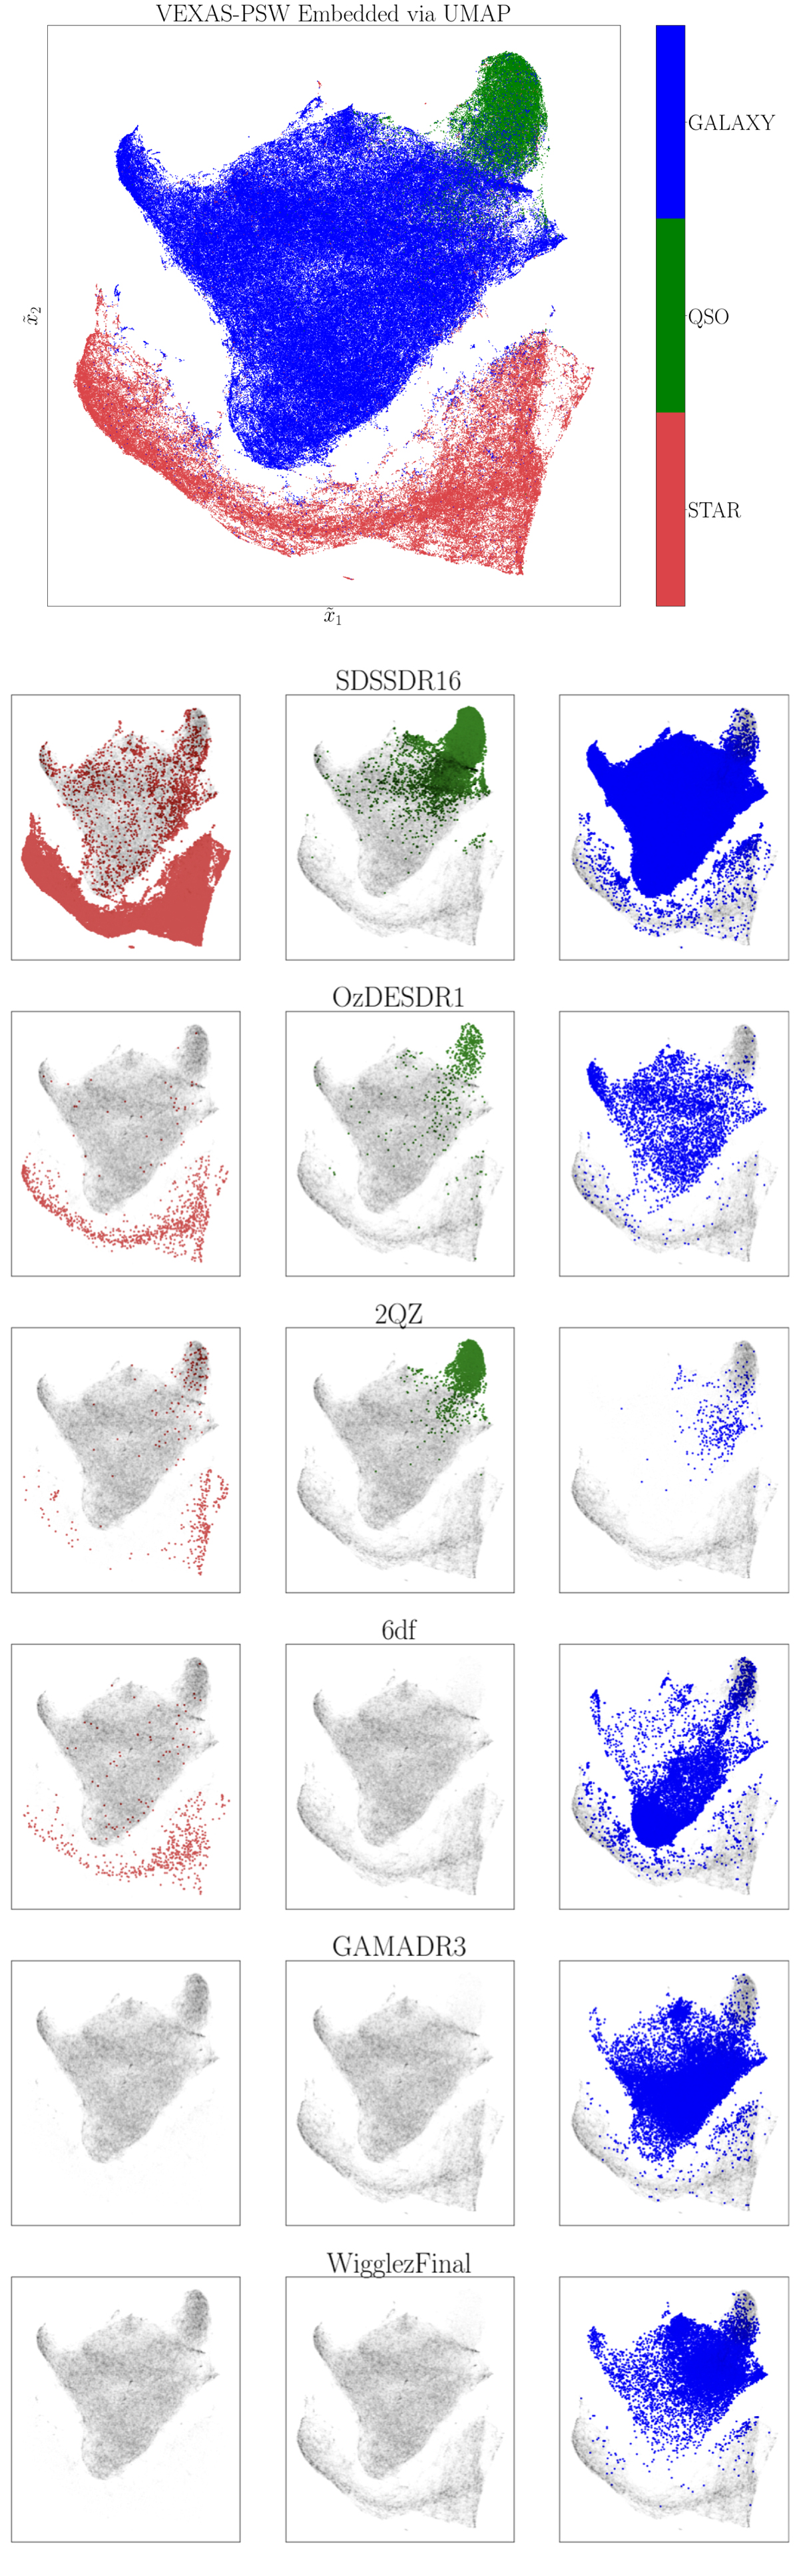
Two-dimensional projection of the VEXAS-PSW sources with a spectroscopic match created with UMAP. Each point represents a source within the two-dimensional reduced space, and it is colour coded according to its spectroscopic classification. Bottom lower panel: each line of three-plots is relative to a different spectroscopic survey, as indicated by the titles. Each panel within a line highlights a different class of objects. Grey points represent the sources belonging to the other two classes instead.
Current usage metrics show cumulative count of Article Views (full-text article views including HTML views, PDF and ePub downloads, according to the available data) and Abstracts Views on Vision4Press platform.
Data correspond to usage on the plateform after 2015. The current usage metrics is available 48-96 hours after online publication and is updated daily on week days.
Initial download of the metrics may take a while.