Free Access
Fig. 1.
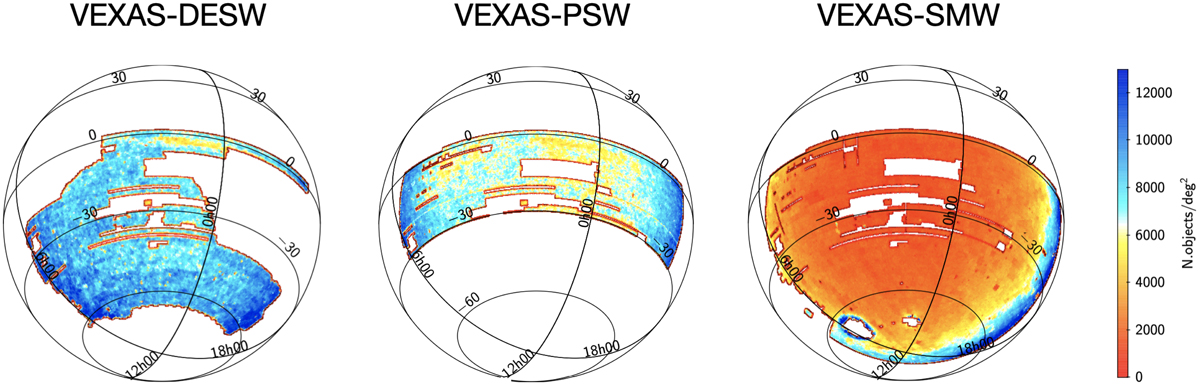
Sky coverage view of the three input VEXAS optical+IR tables. The colours indicate the number of objects per deg2, as shown by the side bar, obtained using a Hierarchical Equal Area isoLatitude Pixelation of a sphere (HEALP IX) with resolution equal to 9.
Current usage metrics show cumulative count of Article Views (full-text article views including HTML views, PDF and ePub downloads, according to the available data) and Abstracts Views on Vision4Press platform.
Data correspond to usage on the plateform after 2015. The current usage metrics is available 48-96 hours after online publication and is updated daily on week days.
Initial download of the metrics may take a while.