Free Access
Fig. 8.
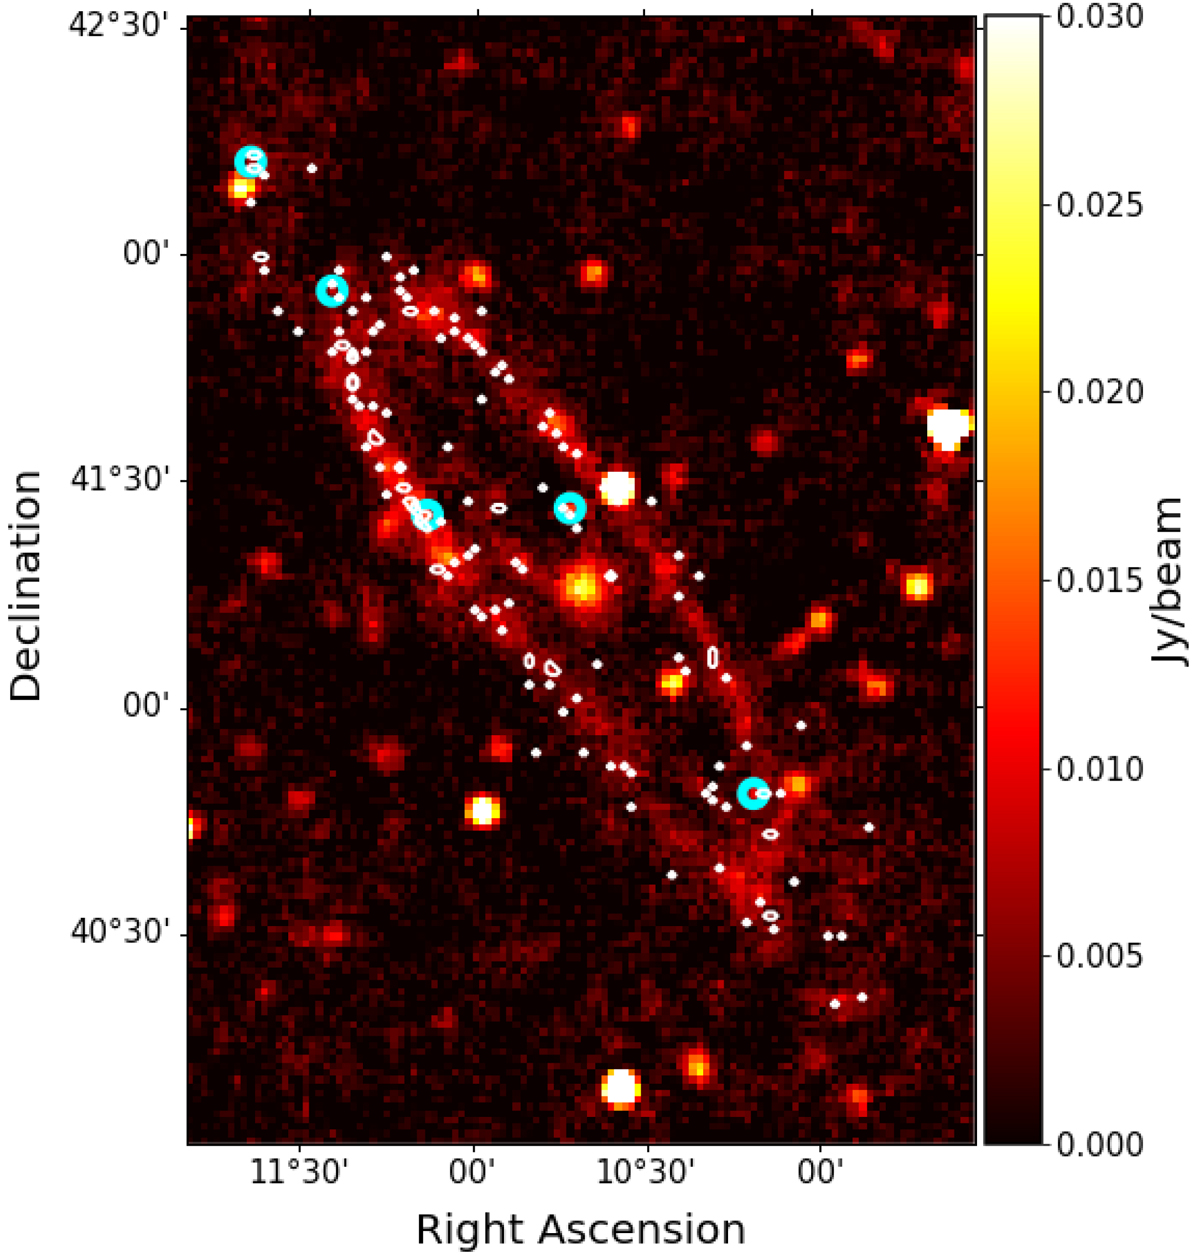
SRT C-band map with compact sources. The 156 SNRs and SNR candidates from (Lee & Lee 2014) are overplotted with white contours. The SRT sources that have a corresponding source within a radius of 1.45′ are shown with cyan circles.
Current usage metrics show cumulative count of Article Views (full-text article views including HTML views, PDF and ePub downloads, according to the available data) and Abstracts Views on Vision4Press platform.
Data correspond to usage on the plateform after 2015. The current usage metrics is available 48-96 hours after online publication and is updated daily on week days.
Initial download of the metrics may take a while.