Fig. A.1.
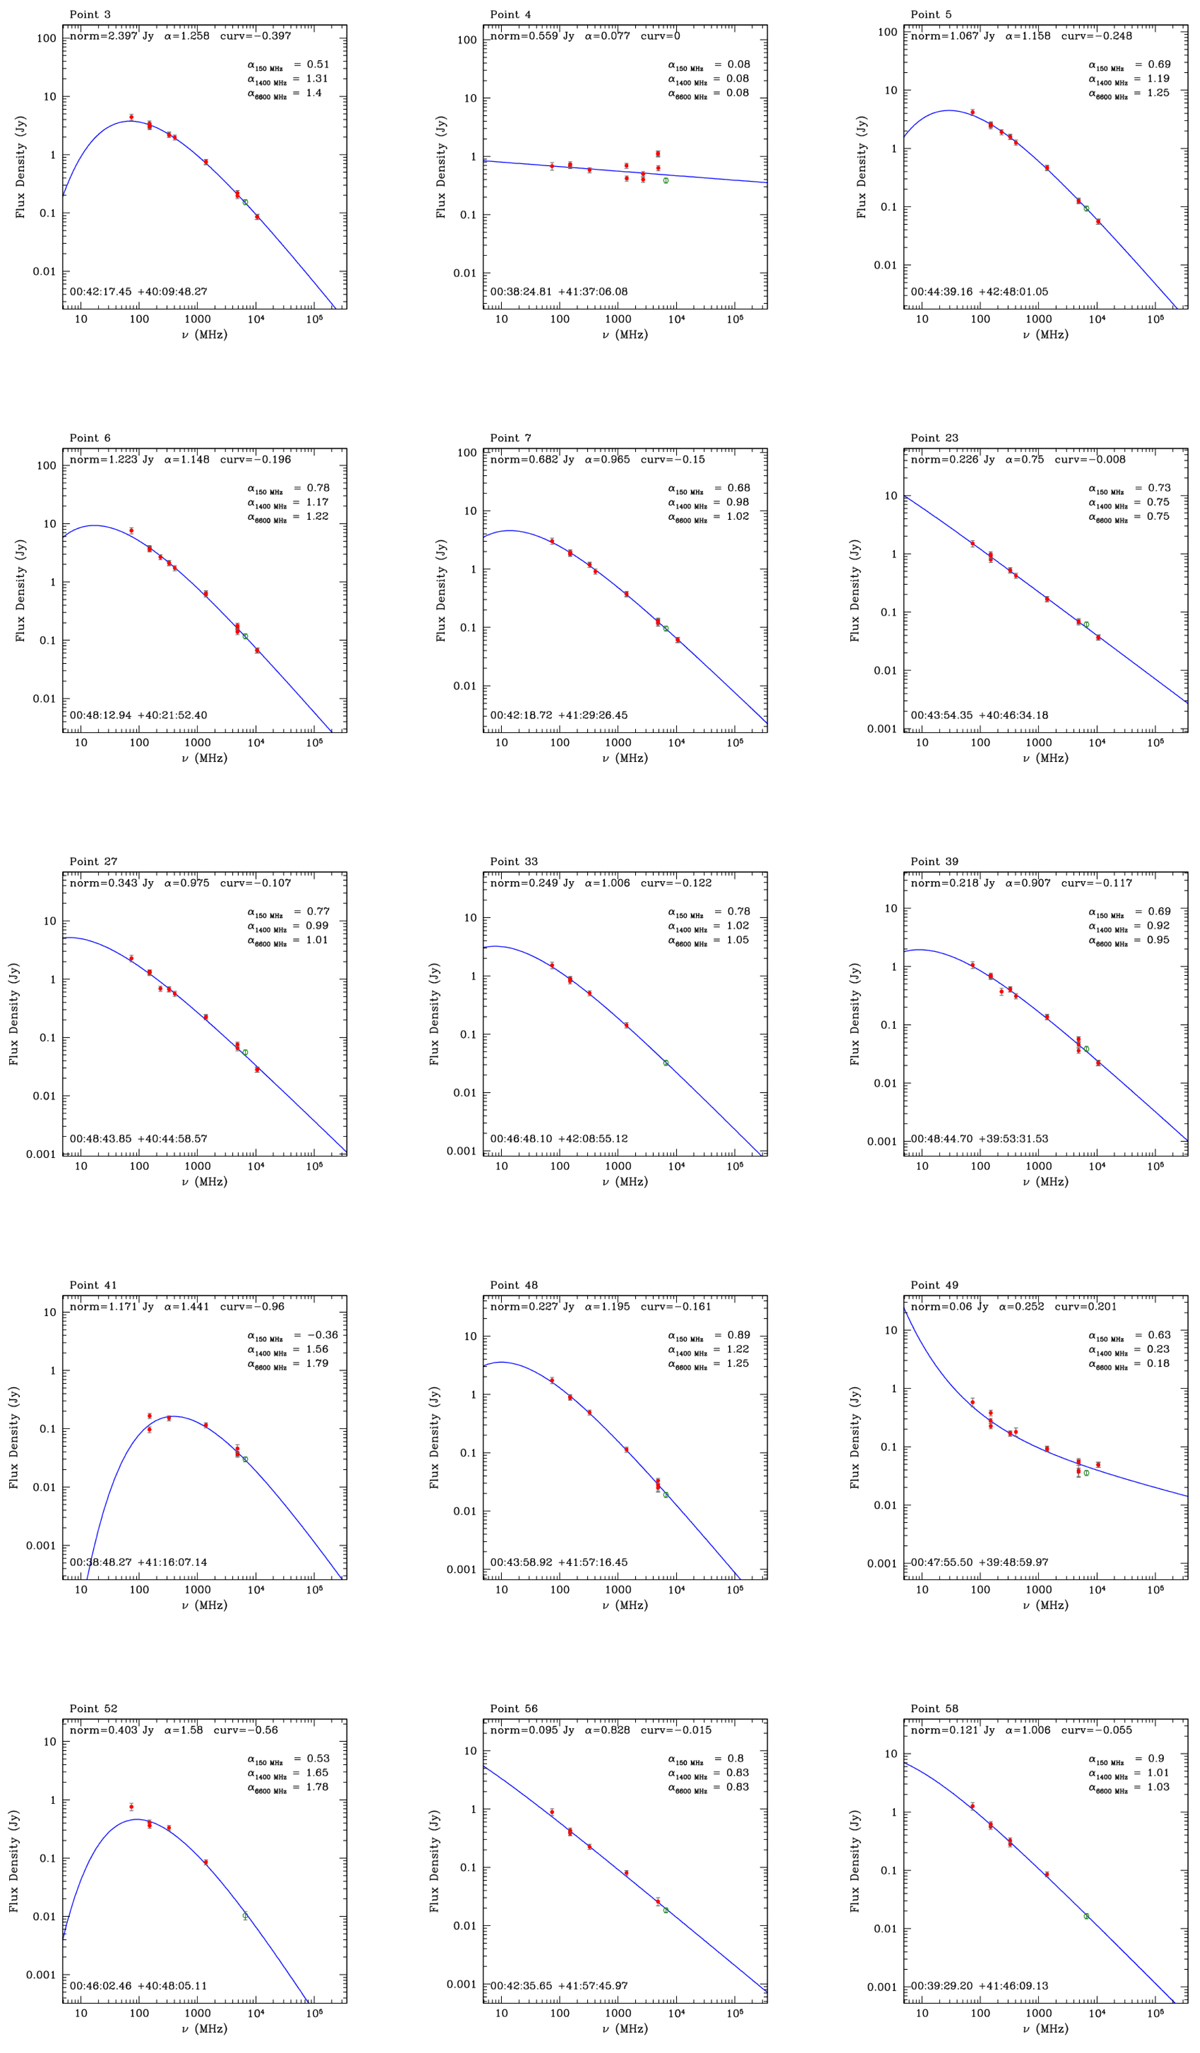
Spectral fit of the 93 compact sources detected in our C-band map. Green points are the new flux densities extracted in this work. Red points are the ancillary data. Each figure shows the compact source RA-Dec coordinates (bottom left), the fit parameters (upper side), and the model spectral indices at 150, 1400, and 6600 MHz (right side).
Current usage metrics show cumulative count of Article Views (full-text article views including HTML views, PDF and ePub downloads, according to the available data) and Abstracts Views on Vision4Press platform.
Data correspond to usage on the plateform after 2015. The current usage metrics is available 48-96 hours after online publication and is updated daily on week days.
Initial download of the metrics may take a while.