Fig. 28.
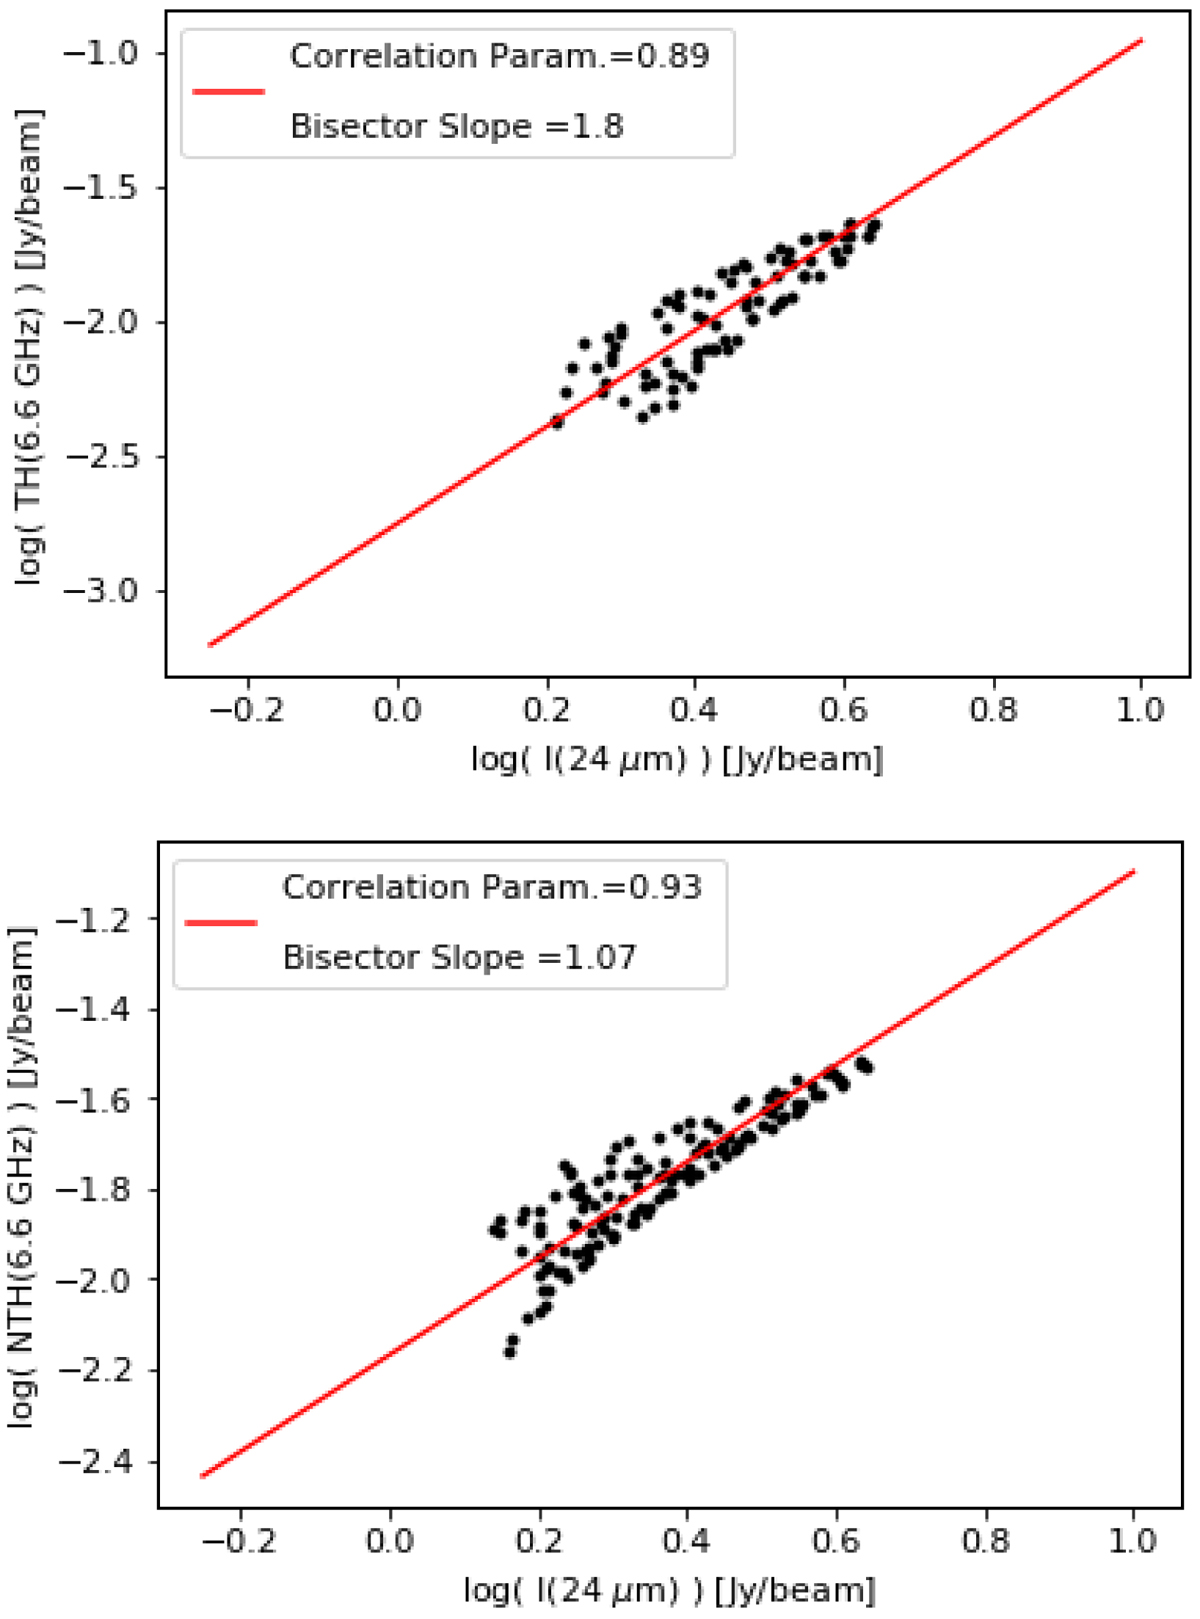
Top: M 31 central region thermal–MIR correlation. Bottom: M 31 central region nonthermal–MIR correlation. It is evident, especially from the bottom panel, that the scatter plots show sharp edges. This comes naturally from the fact that the central region points are distributed over a circular area with sharp edges. Log–log slopes for thermal and nonthermal emission in the central region are respectively 1.80 ± 0.06 and 1.07 ± 0.02. Only pixels above 3σ have been used.
Current usage metrics show cumulative count of Article Views (full-text article views including HTML views, PDF and ePub downloads, according to the available data) and Abstracts Views on Vision4Press platform.
Data correspond to usage on the plateform after 2015. The current usage metrics is available 48-96 hours after online publication and is updated daily on week days.
Initial download of the metrics may take a while.