Fig. 23.
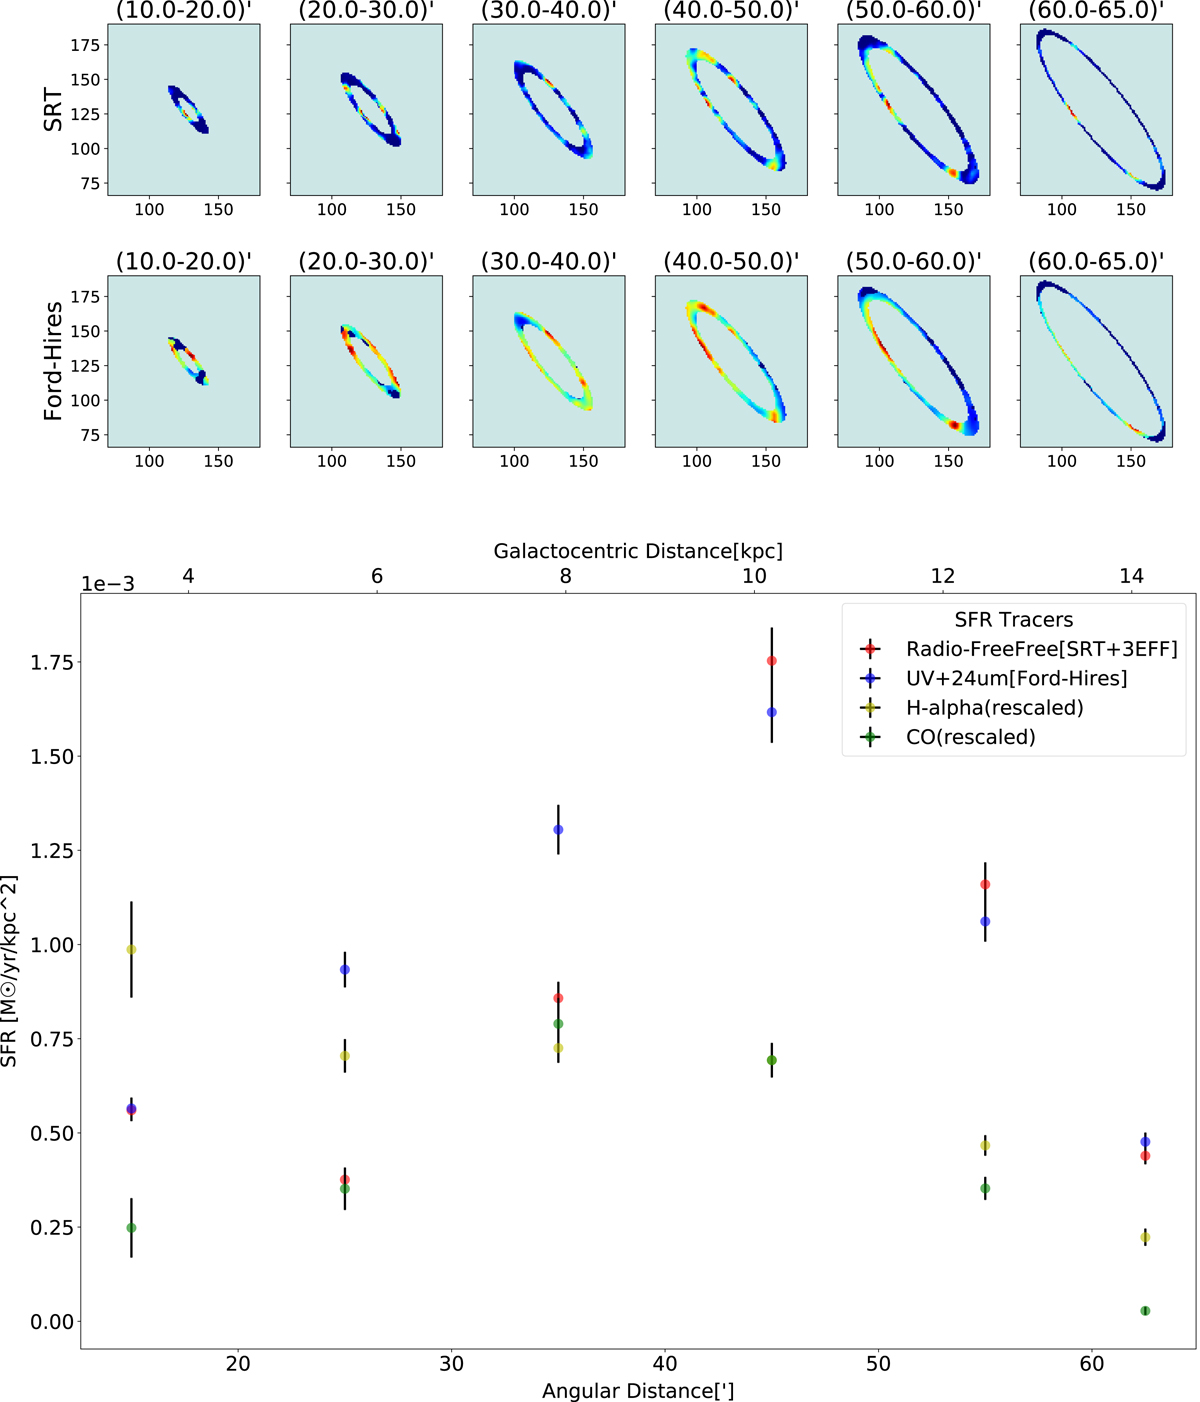
Top panel: regions of integration used to extract the integrated SFR values reported in the bottom panel and in Table 8. Bottom panel: integrated SFR in annular regions of increasing galactocentric distance for four different tracers. For the radio–free-free and UV SFR maps, the plot illustrates the SFR value integrated in annular regions of increasing galactocentric distance (see top panel) and renormalized by the area of the region. For Hα and CO maps, we report the flux density renormalized to the mean SRT-integrated SFR value in order to be able to visually compare the four different trends. The SFR values from the radio–free-free map are also reported in Table 8.
Current usage metrics show cumulative count of Article Views (full-text article views including HTML views, PDF and ePub downloads, according to the available data) and Abstracts Views on Vision4Press platform.
Data correspond to usage on the plateform after 2015. The current usage metrics is available 48-96 hours after online publication and is updated daily on week days.
Initial download of the metrics may take a while.