Fig. 22.
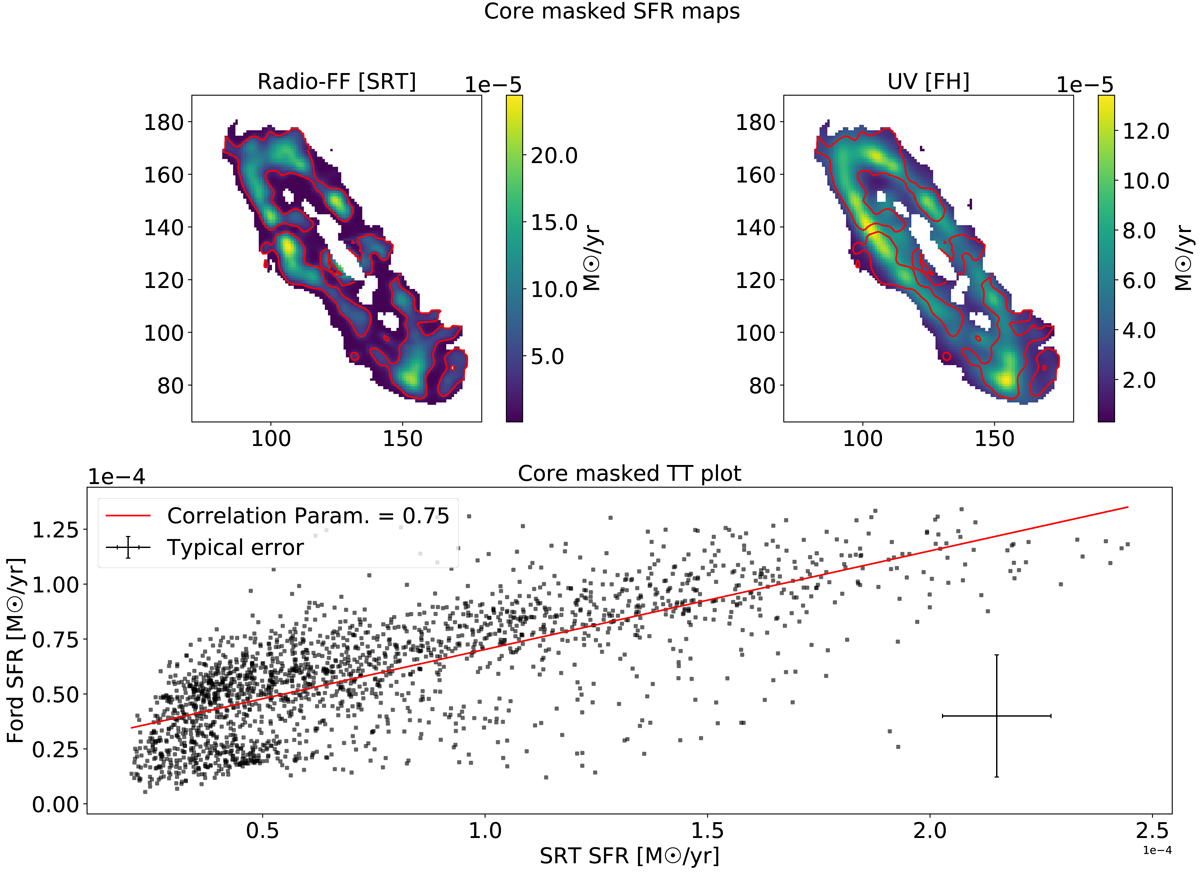
T-T plot between the radio–free-free SFR map and the F13 map with the central area masked. The red contours on the top two maps highlight the regions with S/N > 3 in our SFR map (top-left panel), and therefore the pixels that have been considered in this analysis. The plot shows a good correlation between the two maps in the ring region with a correlation parameter of rring = 0.75.
Current usage metrics show cumulative count of Article Views (full-text article views including HTML views, PDF and ePub downloads, according to the available data) and Abstracts Views on Vision4Press platform.
Data correspond to usage on the plateform after 2015. The current usage metrics is available 48-96 hours after online publication and is updated daily on week days.
Initial download of the metrics may take a while.