Fig. 9.
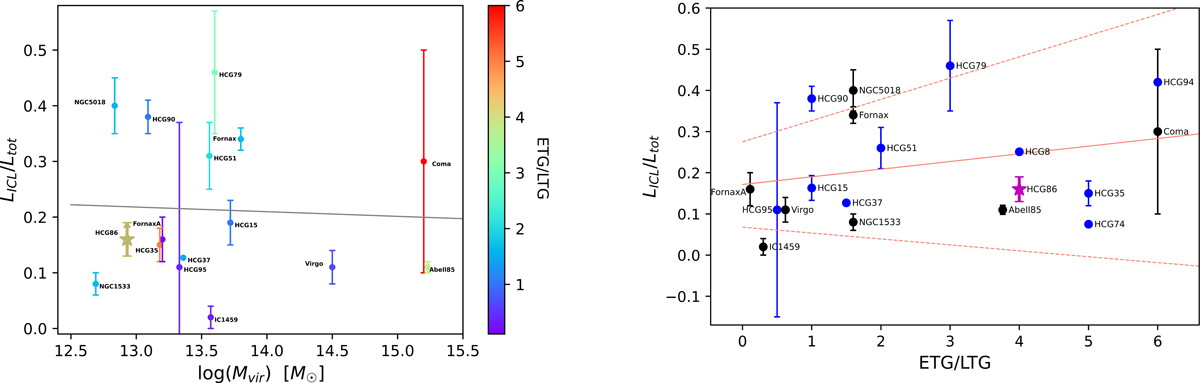
LICL/LTOT vs Mvir and LICL/LTOT vs ETGs-to-LTGs ratio. Left panel: luminosity of the ICL/IGL component normalised to the total cluster or group luminosity as a function of the virial mass. The value derived for HCG 86 is compared with those for several Hickson Compact Groups, taken from Da Rocha et al. (2008), Selim & Iqbal (2008), Pildis et al. (1995), Poliakov et al. (2021). The estimate for HCG 94 and HCG 37 are provided by Pildis et al. (1995) and Poliakov et al. (2021) without an error range, respectively. In addition, values for the IGL estimated for other groups of galaxies derived using VEGAS data are also shown. These are: NGC 5018 group (Spavone et al. 2018), NGC 1533 triplet, IC 1459 group (Iodice et al. 2020), and Fornax A subgroup (Raj et al. 2020). The ICL fraction for the Fornax cluster is derived by Spavone et al. (2020) using FDS data. We also report the values for Virgo (Mihos et al. 2017), Coma (Melnick et al. 1977; Thuan & Kormendy 1977; Bernstein et al. 1995; Adami et al. 2005; Jiménez-Teja et al. 2019) and Abell 85 clusters (Brough et al. 2017; Montes et al. 2021). Although these estimates are all obtained with the same approach, it must be taken into account that some of them come from different photometric bands. The colour of each point is coded according to its ETG-to-LTG ratio. The black line corresponds to the best fit for the linear correlation and it seems to suggest that any evident trend exists between the amount of ICL and Mvir. Right panel: luminosity of the ICL component normalised to the total cluster or group luminosity as a function of the ETGs-to-LTGs ratio. The IGL for all HCGs available in literature are marked as blue points. Other estimates for groups and clusters of galaxies are indicated with the black points. The value found in this work for HCG 86 is marked with magenta star-like point. The coral solid line corresponds to the best fit for the linear correlation and the dashed coral lines mark the 2σ significance range of the correlation. The values for HCG 74, HCG 8, HCG 37, and HCG 17 (the latter overlaps to HCG 86) come from Poliakov et al. (2021).
Current usage metrics show cumulative count of Article Views (full-text article views including HTML views, PDF and ePub downloads, according to the available data) and Abstracts Views on Vision4Press platform.
Data correspond to usage on the plateform after 2015. The current usage metrics is available 48-96 hours after online publication and is updated daily on week days.
Initial download of the metrics may take a while.