Fig. 8.
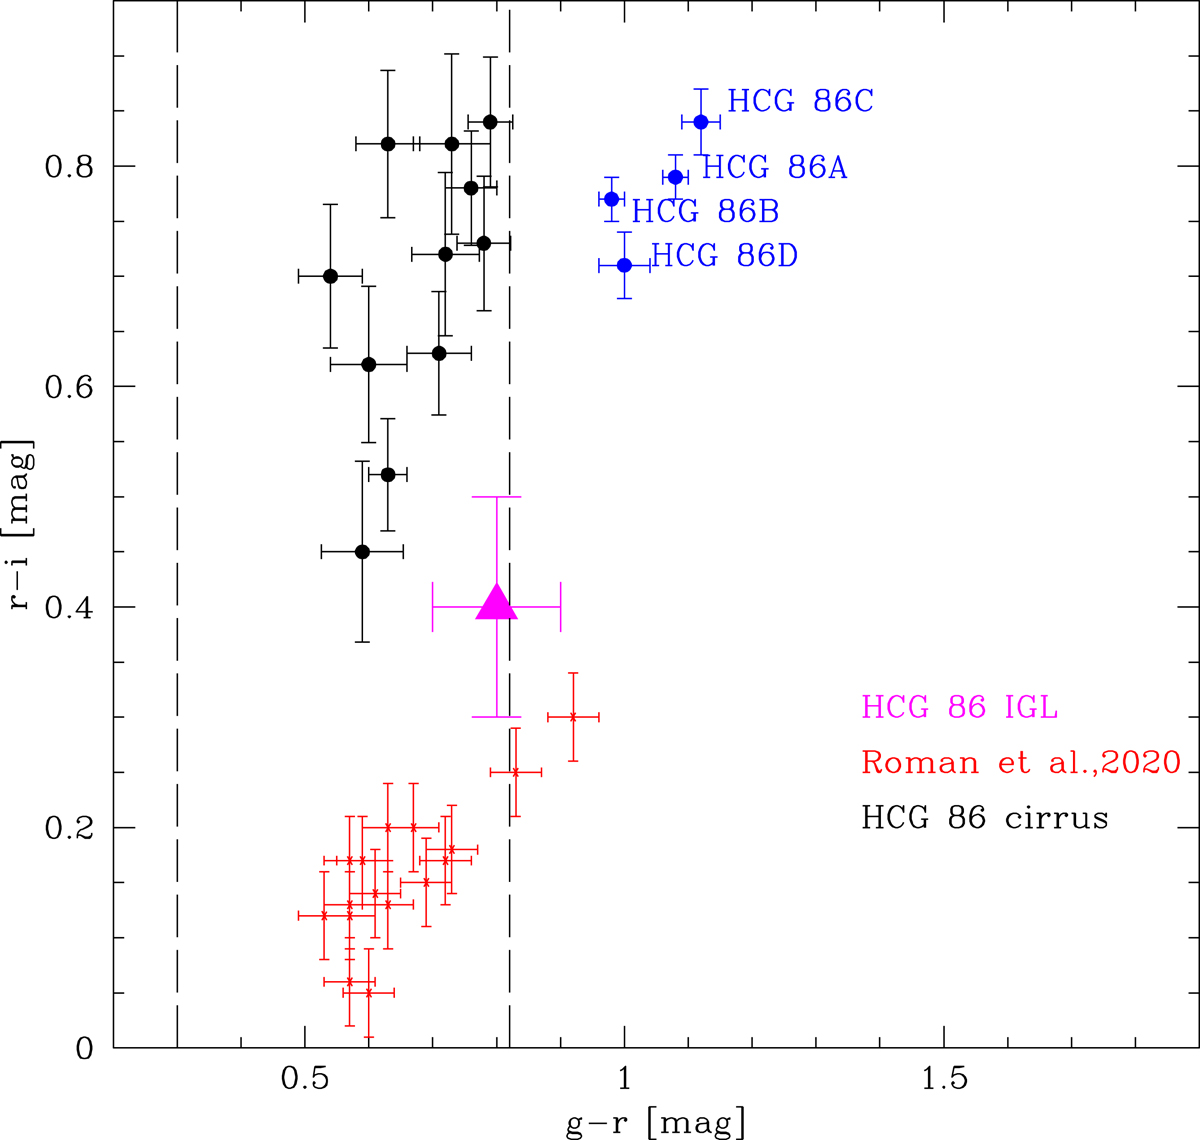
g − r versus r − i colour–colour diagram. Colours of the cirrus derived in the West filament are in black. The integrated colours of the group members in HCG 86 are in blue. The average value of the IGL in the group is shown as magenta triangle (see Sect. 4.1). The small red points are the colours derived for Cirrus from Román et al. (2020). The two vertical dashed lines indicate the range of g − r colours of the IGL in the HCGs studied by Da Rocha & Mendes de Oliveira (2005), Da Rocha et al. (2008). In this colour–colour plot the region in which the IGL lies is different both from those typical of cirrus (Román et al. 2020) and from cirrus in the HCG 86 space. This confirms that IGL in HCG 86 are not largely contaminated by cirrus.
Current usage metrics show cumulative count of Article Views (full-text article views including HTML views, PDF and ePub downloads, according to the available data) and Abstracts Views on Vision4Press platform.
Data correspond to usage on the plateform after 2015. The current usage metrics is available 48-96 hours after online publication and is updated daily on week days.
Initial download of the metrics may take a while.