Fig. 6.
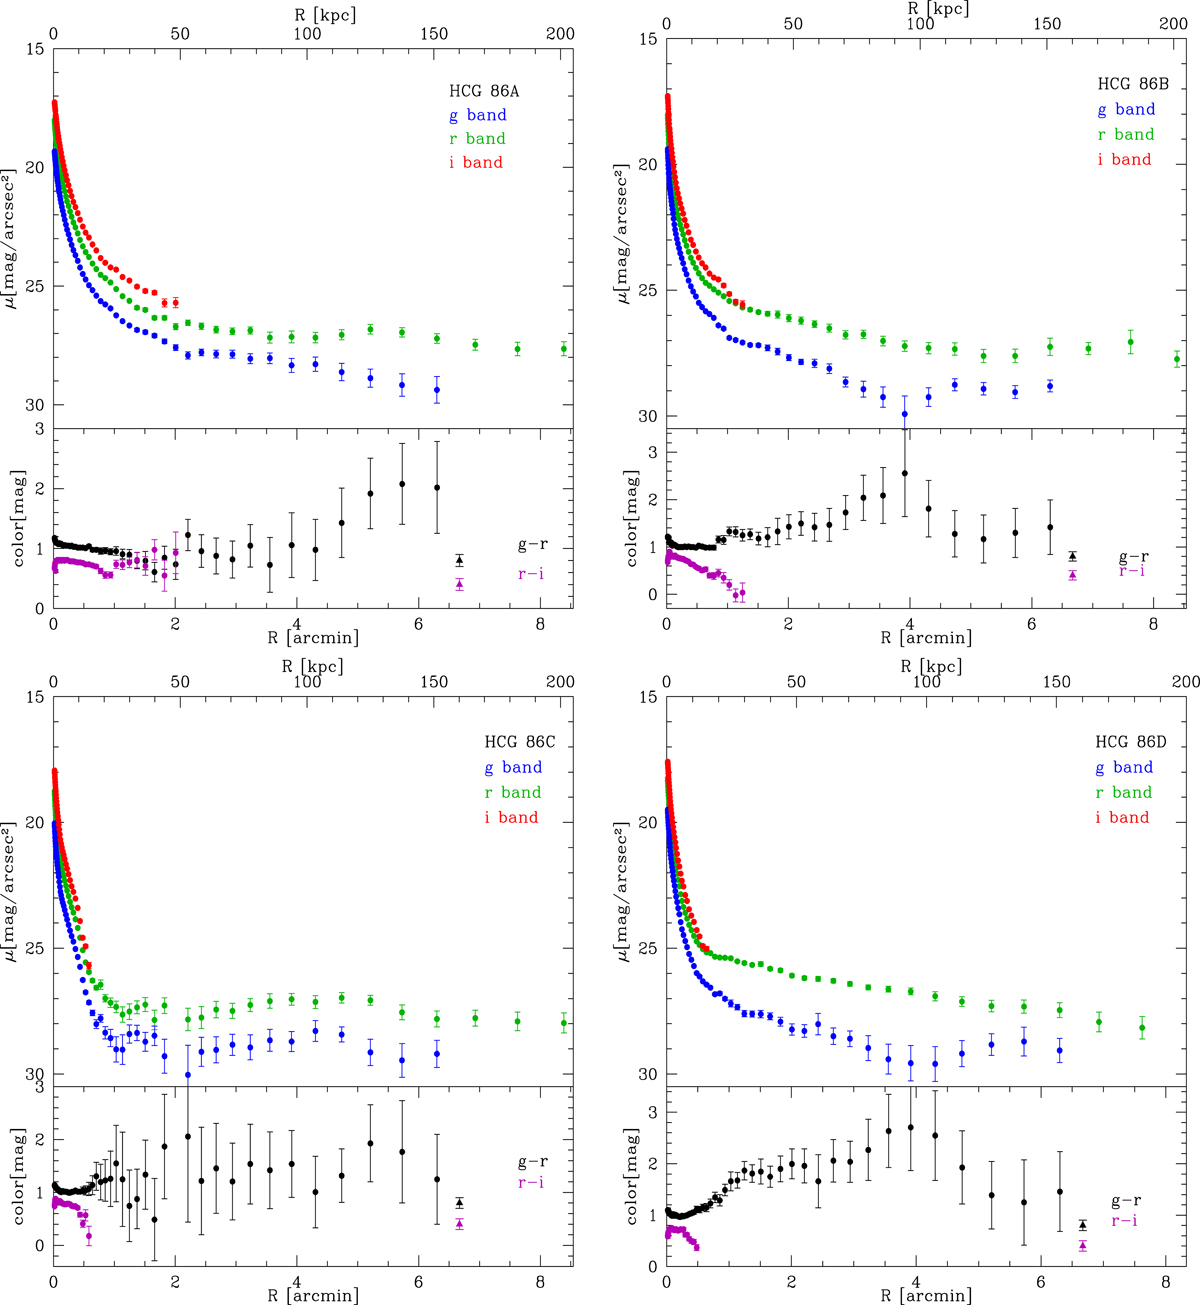
Azimuthally-averaged surface brightness profiles and colour profiles of the group members. Top panels: azimuthally-averaged surface brightness profiles of HCG 86A, HCG 86B, HCG 86C and HCG 86D in VST g (blue), r (green), and i (red) bands. Bottom panels: g − r (black) and r − i (violet) colour profiles of HCG 86A, HCG 86B, HCG 86C, and HCG 86D. The points at 6.67 arcmin (i.e. Rlim in the g band) in each panel correspond to the integrated colours of the IGL component.
Current usage metrics show cumulative count of Article Views (full-text article views including HTML views, PDF and ePub downloads, according to the available data) and Abstracts Views on Vision4Press platform.
Data correspond to usage on the plateform after 2015. The current usage metrics is available 48-96 hours after online publication and is updated daily on week days.
Initial download of the metrics may take a while.