Fig. 5.
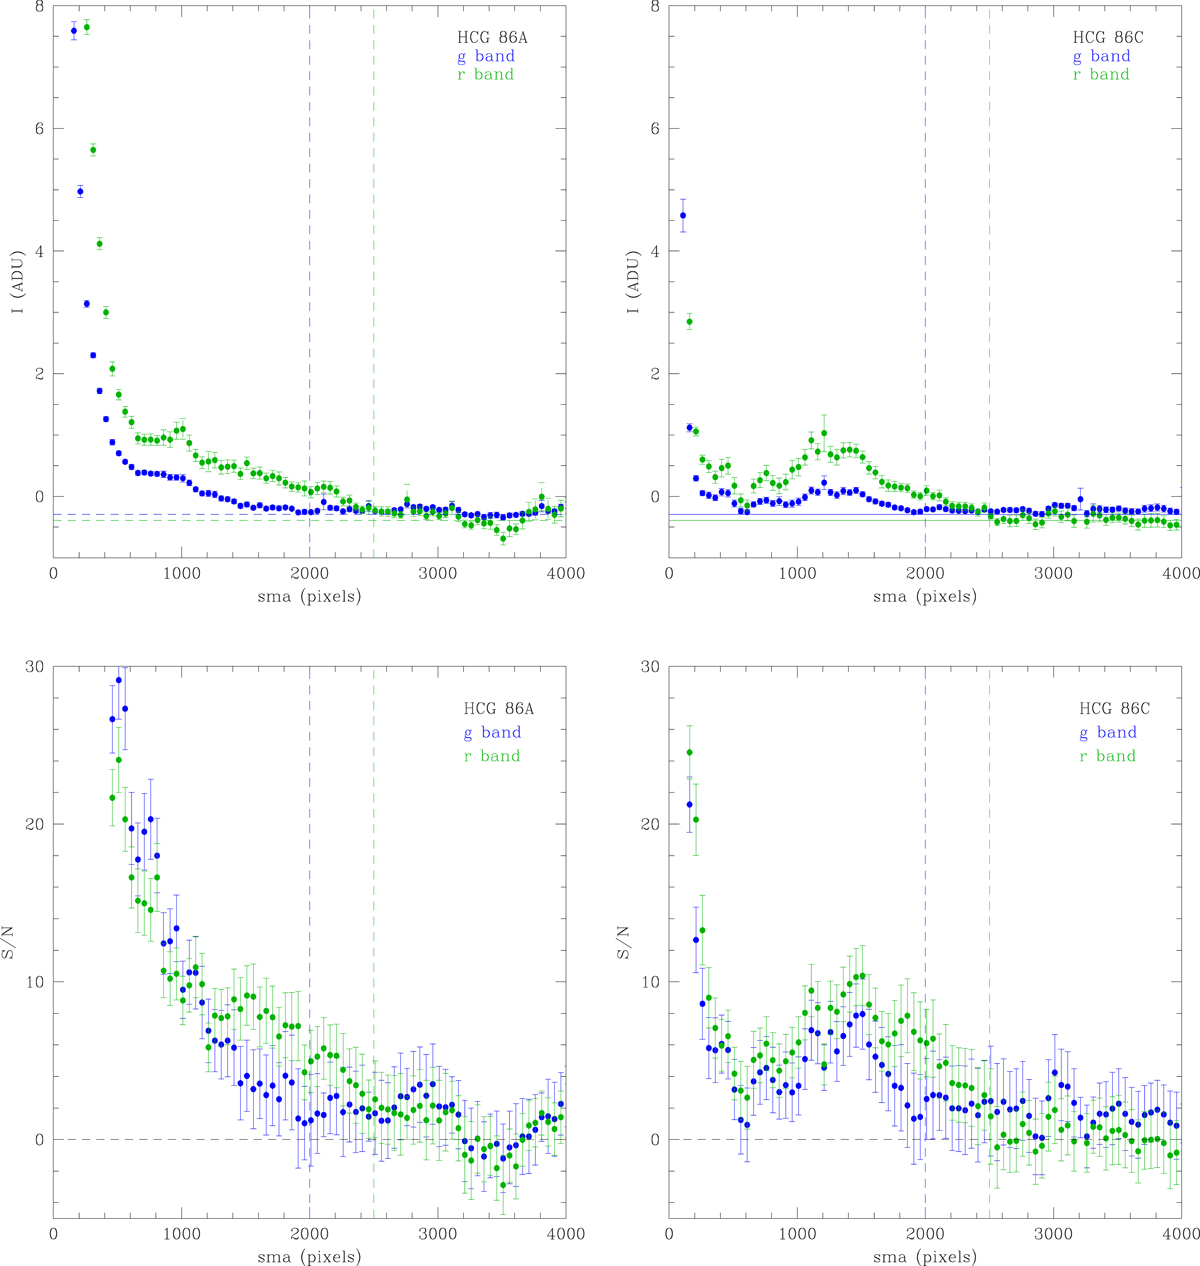
Residual background fluctuations, Rlim and S/N estimate. Top panels: intensity profiles for HCG 86A (left panel) and HCG 86C (right panel) in the g and r bands. The two vertical dashed lines show the estimated value for Rlim for each band and the horizontal lines indicate the average value of the residual background fluctuations in each band. Bottom panels: S/N profiles for HCG 86A (left panel) and HCG 86C (right panel) in the g (blue points) and r (green points) bands. The vertical dashed lines indicate the Rlim for each band and the horizontal lines indicate the zero value for signal to noise ratio. The bump observed at ∼1000−2000 pixels, in both g and r profiles centred on the HCG 86C, reasonably corresponds to the IGL contribution around the core of the group.
Current usage metrics show cumulative count of Article Views (full-text article views including HTML views, PDF and ePub downloads, according to the available data) and Abstracts Views on Vision4Press platform.
Data correspond to usage on the plateform after 2015. The current usage metrics is available 48-96 hours after online publication and is updated daily on week days.
Initial download of the metrics may take a while.