Fig. 4.
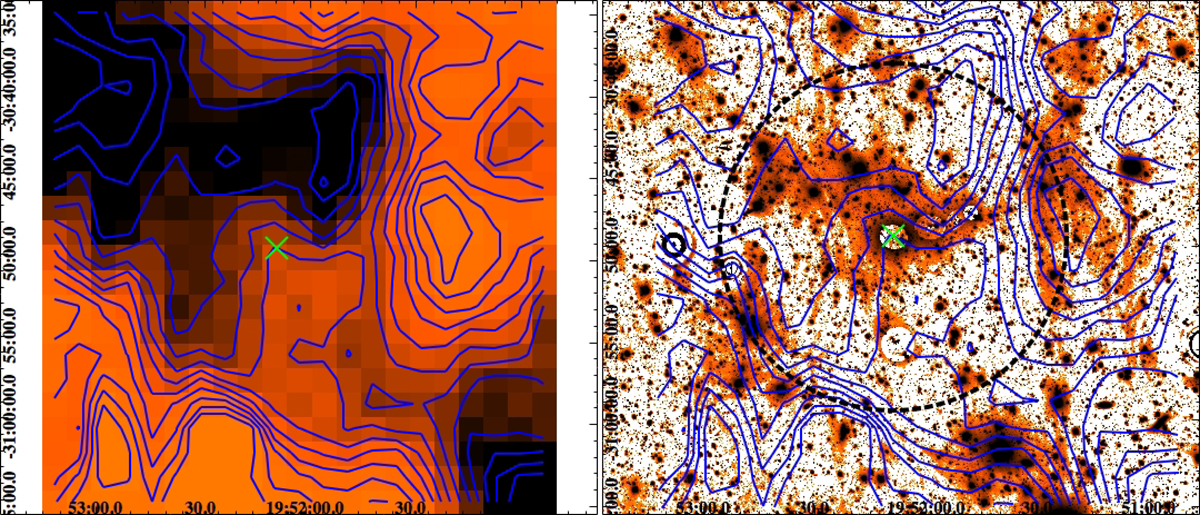
Superposition of the intensity contours of the cirrus on the field of HCG 86. Left panel: cirrus map derived from the 100 μm image available at the NASA/IPAC Infrared Science Archive, with superimposed contours (blue) in the flux interval from 9.25 − 9.78 MJy sr−1. Right panel: residual image in the g band, where the brightest regions of the group members were subtracted from the original image. The image is 35 × 30 arcmin. The blue lines are the cirrus intensity levels shown in the left panel. The dashed black circle indicates the circular region of R = 600 arcsec. The green cross indicates the centre of the HCG 86 group in both panels. The residual image shows an extended envelope of diffuse light symmetrically distributed around the group, as already pointed out from unsharp-masked image of HCG 86 (see Fig. 3).
Current usage metrics show cumulative count of Article Views (full-text article views including HTML views, PDF and ePub downloads, according to the available data) and Abstracts Views on Vision4Press platform.
Data correspond to usage on the plateform after 2015. The current usage metrics is available 48-96 hours after online publication and is updated daily on week days.
Initial download of the metrics may take a while.