Free Access
Fig. 2.
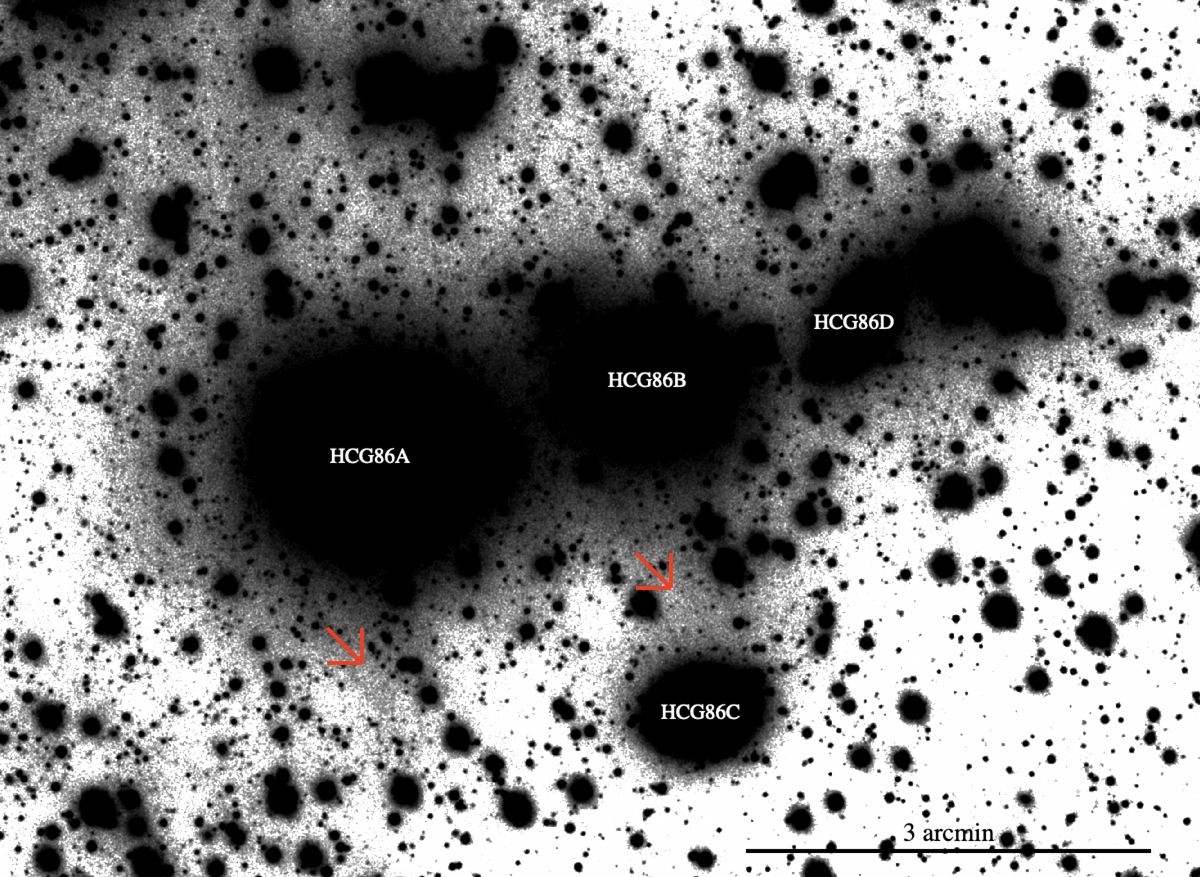
Enlarged region of the deep VST image in the g band centred on the HCG 86 group, of 8.90 × 6.49 arcmin. The two red arrows indicate the faint low-surface brightness features contributing to the IGL. The brightest group members (HCG 86A, HCG 86B, HCG 86C, and HCG 86D) are also marked in the image.
Current usage metrics show cumulative count of Article Views (full-text article views including HTML views, PDF and ePub downloads, according to the available data) and Abstracts Views on Vision4Press platform.
Data correspond to usage on the plateform after 2015. The current usage metrics is available 48-96 hours after online publication and is updated daily on week days.
Initial download of the metrics may take a while.