Fig. A.1.
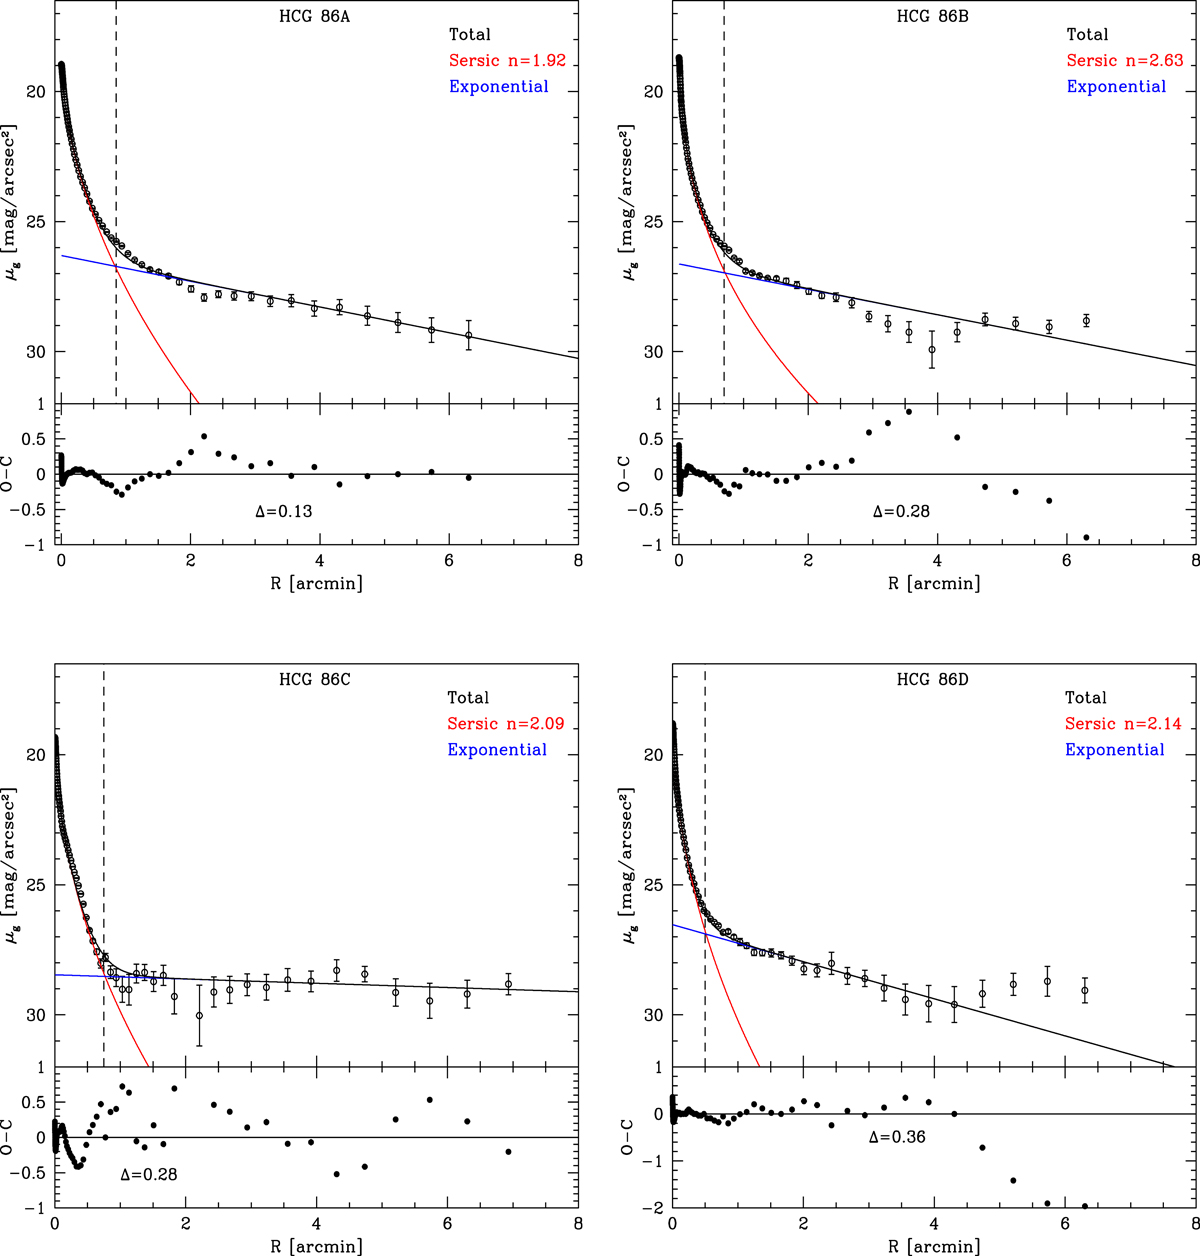
Two components models of the azimuthally averaged surface brightness profiles of galaxies in HCG 86 group. The blue line indicates a fit to the outer diffuse component (halo+IGL). The red line indicates a fit to the inner regions with a Sérsic profile, and the black line indicates the sum of the components in each fit. The vertical dashed lines show the estimated value for Rtr for each galaxy. Bottom panel: Δ rms scatter of the data minus the model (see text for details).
Current usage metrics show cumulative count of Article Views (full-text article views including HTML views, PDF and ePub downloads, according to the available data) and Abstracts Views on Vision4Press platform.
Data correspond to usage on the plateform after 2015. The current usage metrics is available 48-96 hours after online publication and is updated daily on week days.
Initial download of the metrics may take a while.