Free Access
Fig. 3.
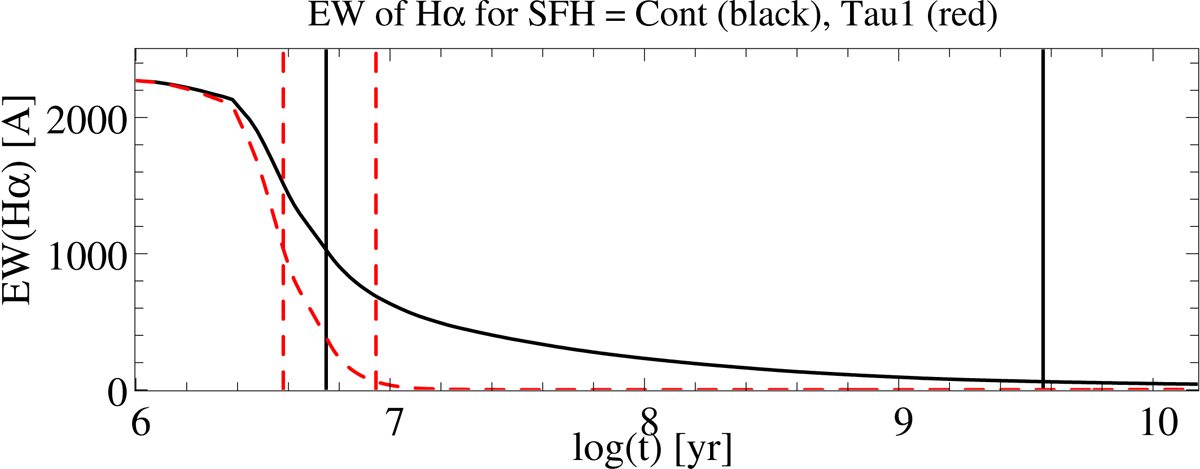
Evolution of EW(Hα) as a function of galaxy age for the CONT (solid black line) and TAU1 (dashed red line) models. The solid black and dashed vertical red lines show the ages at which, for each SFH model, the nebular emission contribution is dominant or negligible.
Current usage metrics show cumulative count of Article Views (full-text article views including HTML views, PDF and ePub downloads, according to the available data) and Abstracts Views on Vision4Press platform.
Data correspond to usage on the plateform after 2015. The current usage metrics is available 48-96 hours after online publication and is updated daily on week days.
Initial download of the metrics may take a while.