Free Access
Fig. 14.
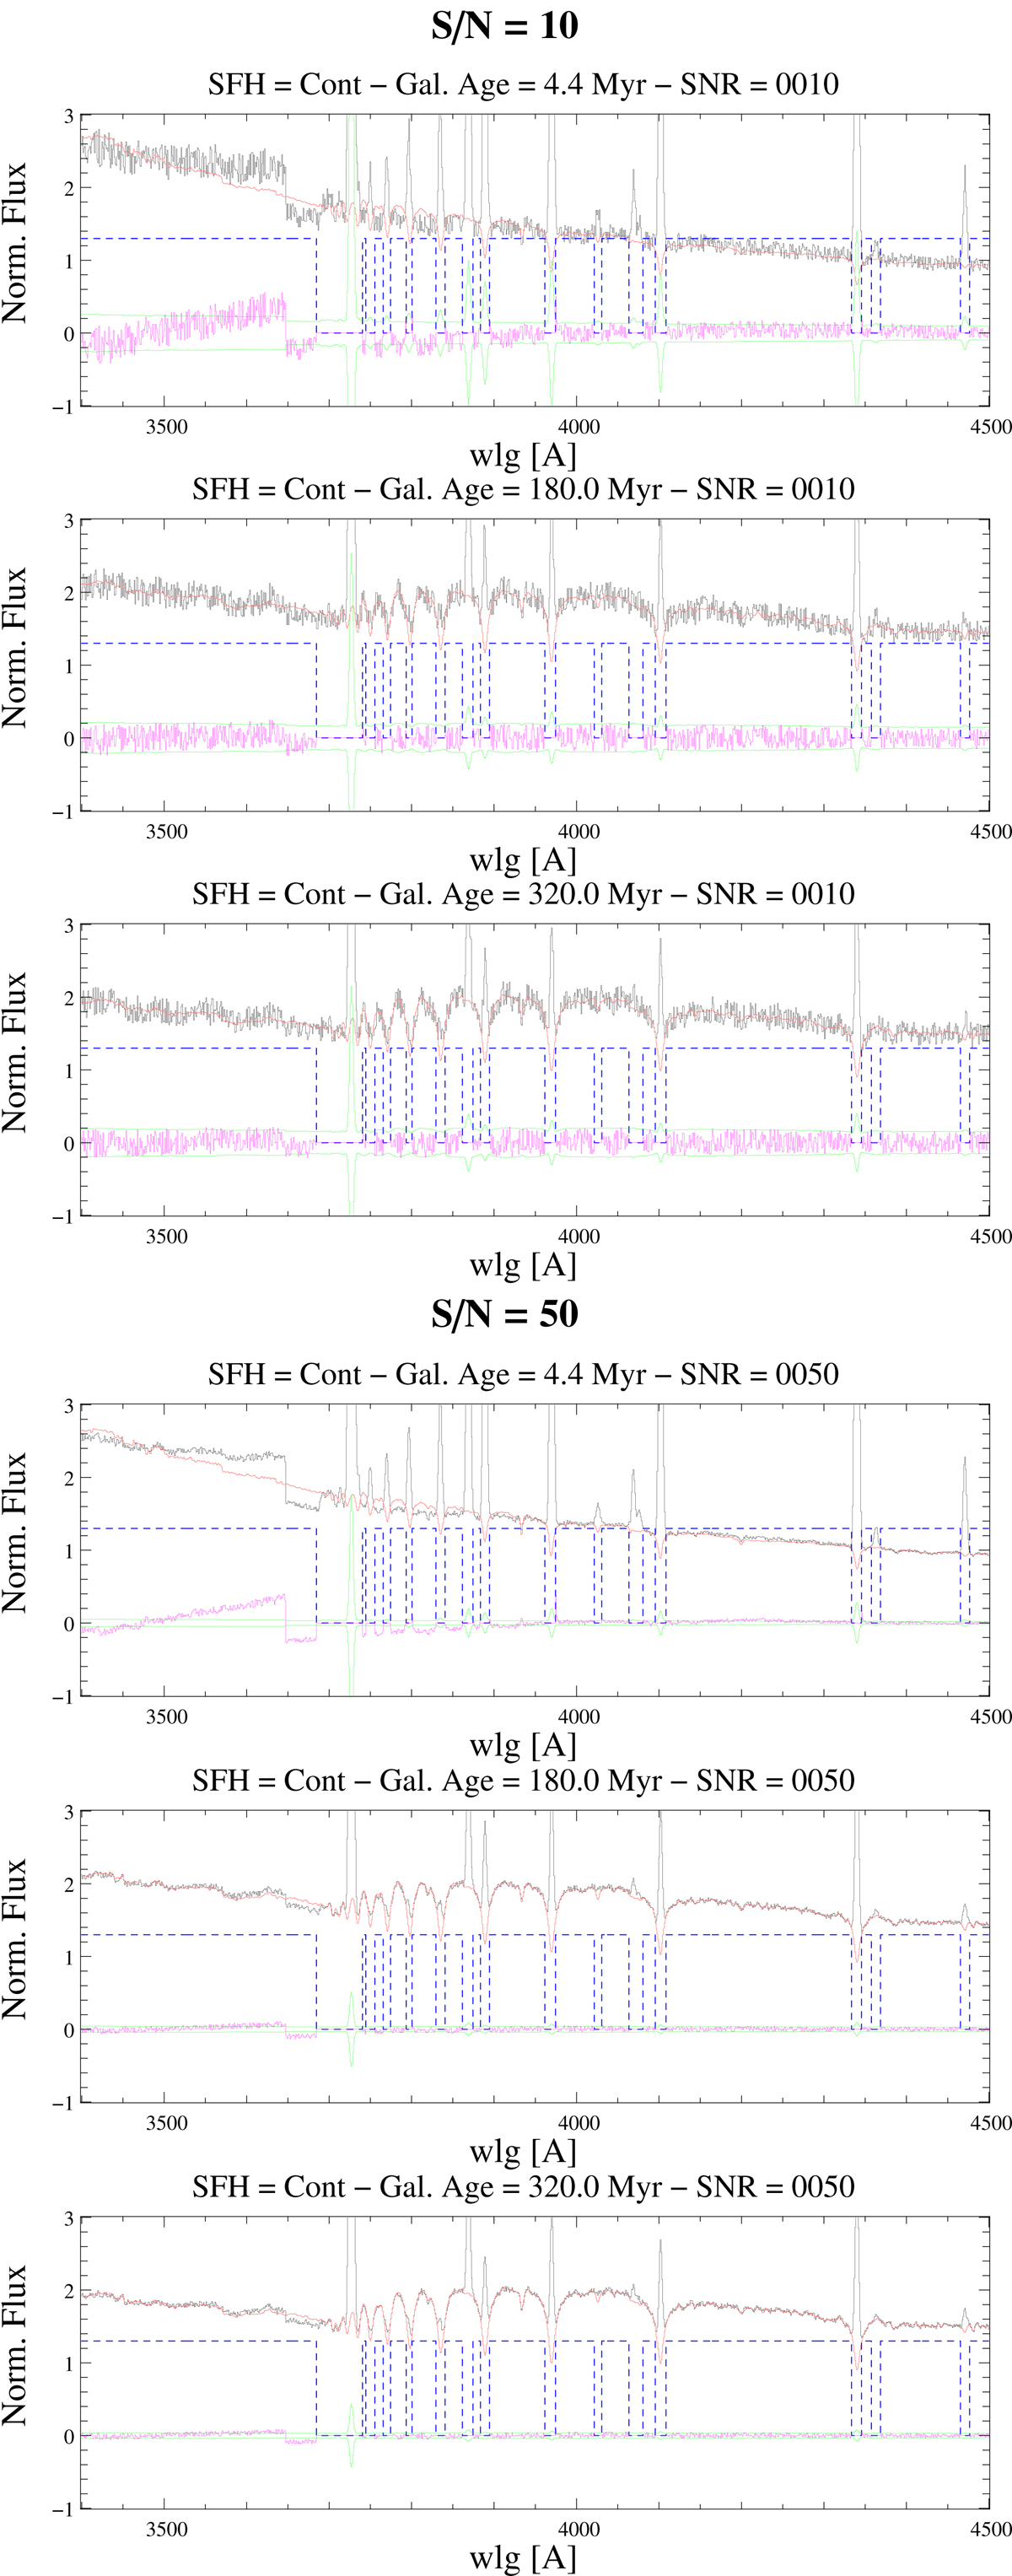
STECKMAP best-fit spectrum for CONT models at 4.4, 180, and 320 Myr and S/N = 10 (top panels), and 50 (bottom panels). The black and red lines show the input and the best-fit spectrum, respectively. The blue, magenta, and green lines show the mask, the residual and the errors, respectively.
Current usage metrics show cumulative count of Article Views (full-text article views including HTML views, PDF and ePub downloads, according to the available data) and Abstracts Views on Vision4Press platform.
Data correspond to usage on the plateform after 2015. The current usage metrics is available 48-96 hours after online publication and is updated daily on week days.
Initial download of the metrics may take a while.