Fig. 9
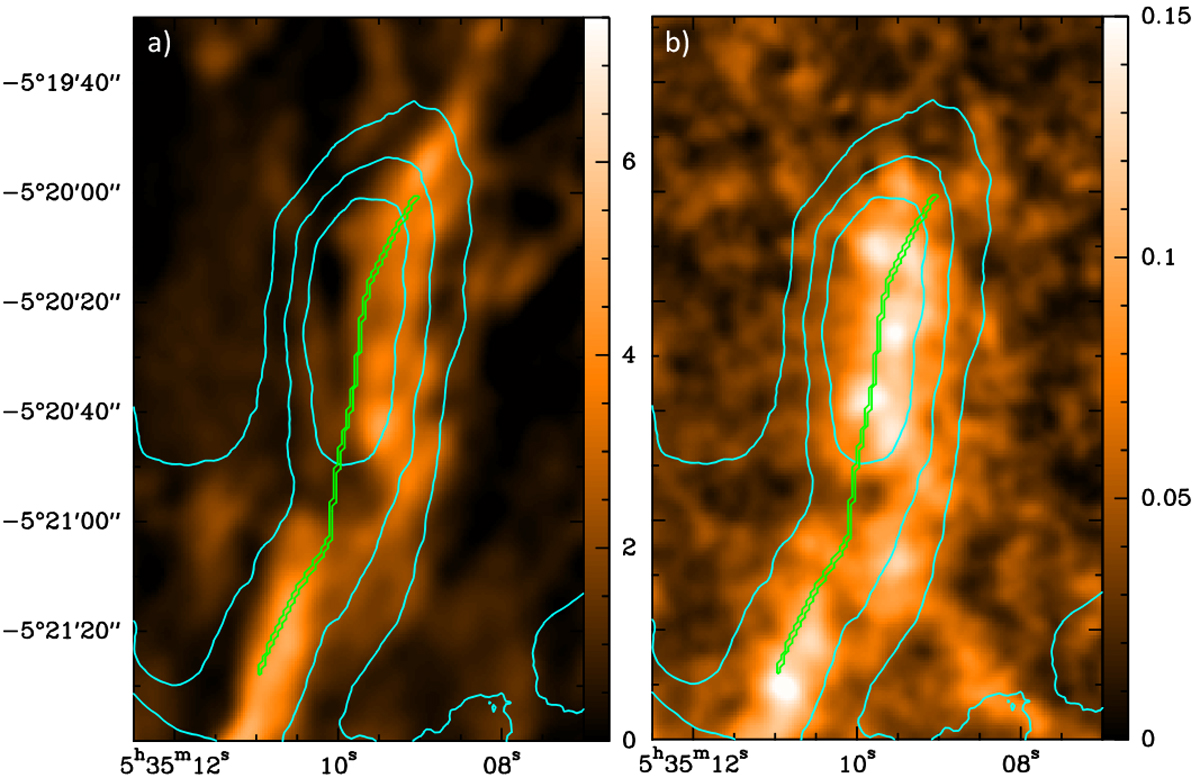
Comparison of our ArTéMiS column density map (cyan contours) with (a) the ALMA+30m N2H+ moment-0 map from Hacar et al. (2018) and (b) the VLA+GBT NH3 moment-0 map from Monsch et al. (2018) for the filament we associate with fibre 9. The ArTéMiS column density contours are 5, 7, and 9 × 1022 cm−2. The green line shows the filament’s crest as derived with DisPerSE.
Current usage metrics show cumulative count of Article Views (full-text article views including HTML views, PDF and ePub downloads, according to the available data) and Abstracts Views on Vision4Press platform.
Data correspond to usage on the plateform after 2015. The current usage metrics is available 48-96 hours after online publication and is updated daily on week days.
Initial download of the metrics may take a while.