Fig. 8
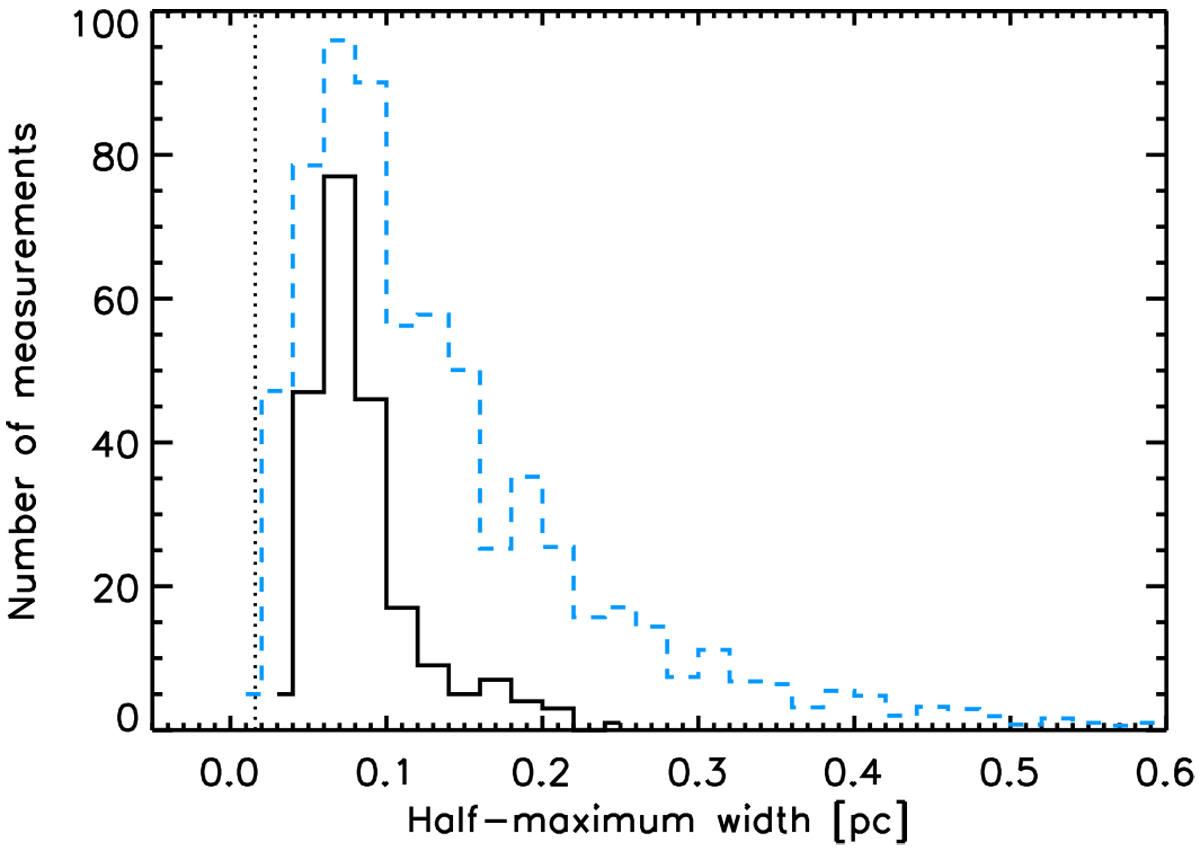
Histogram of 221 independent individual width measurements made at beam-spaced positions along the whole (OMC-1 + OMC-2 + OMC-3) ISF (solid black line), compared to a similar histogram obtained by Arzoumanian et al. (2019) for a large sample of 599 filaments in eight nearby clouds (dashed blue line). The y-axis of thelatter (blue) histogram was scaled down by a factor of 13 for easier comparison with the ISF histogram. The vertical dashed line marks the spatial resolution (~0.016 pc) of the ArTéMiS 350 μm and columndensity maps used in this paper (Figs. 1 and 3). The median value of the OMC distribution (black histogram) is 0.075 pc, and the interquartile range is 0.03 pc. The median value of the blue distribution is 0.1 pc, and its interquartile range is 0.1 pc.
Current usage metrics show cumulative count of Article Views (full-text article views including HTML views, PDF and ePub downloads, according to the available data) and Abstracts Views on Vision4Press platform.
Data correspond to usage on the plateform after 2015. The current usage metrics is available 48-96 hours after online publication and is updated daily on week days.
Initial download of the metrics may take a while.