Fig. 5
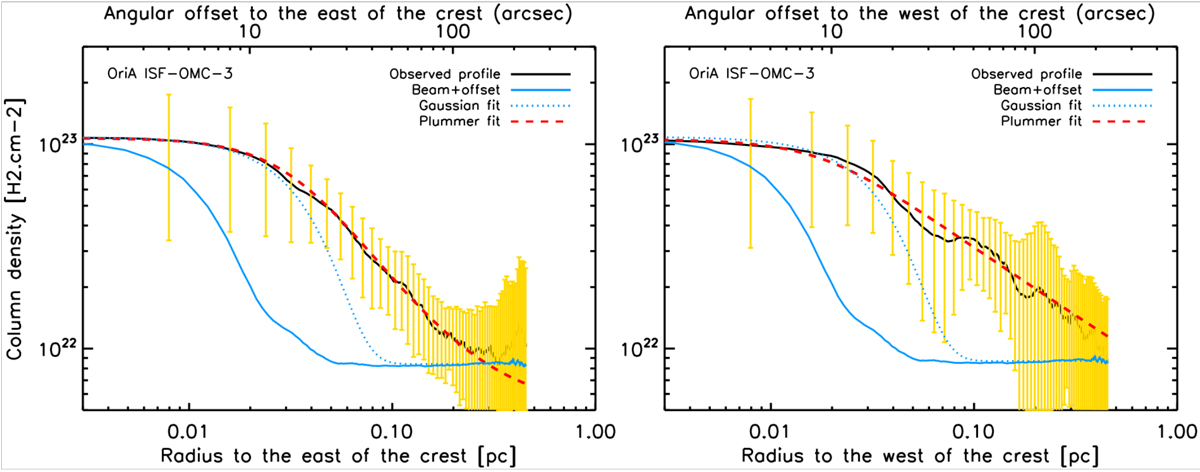
Median radial profiles for the northernmost part of the ISF (solid black curves), covering OMC-3, measured on the H2 column density map perpendicular to the filament crest (see Fig. 4), on the eastern (left panel) and western (right panel) sides of the filament. One data point is shown every half beam (Nyquist sampling). The yellow error bars show the (± 1σ) dispersion of the distribution of radial profiles observed along the filament crest. The solid blue curves show the effective beam profile of the ArTéMiS 350 μm data shifted by a constant offset corresponding to the typical background observed nearby. The dotted blue curves show the best-fit Gaussian (plus constant offset) model to the inner part of the observed profile, and the dashed red curves show the best-fit Plummer model (convolved with the beam) on either side of the filament crest.
Current usage metrics show cumulative count of Article Views (full-text article views including HTML views, PDF and ePub downloads, according to the available data) and Abstracts Views on Vision4Press platform.
Data correspond to usage on the plateform after 2015. The current usage metrics is available 48-96 hours after online publication and is updated daily on week days.
Initial download of the metrics may take a while.