Open Access
Fig. 3
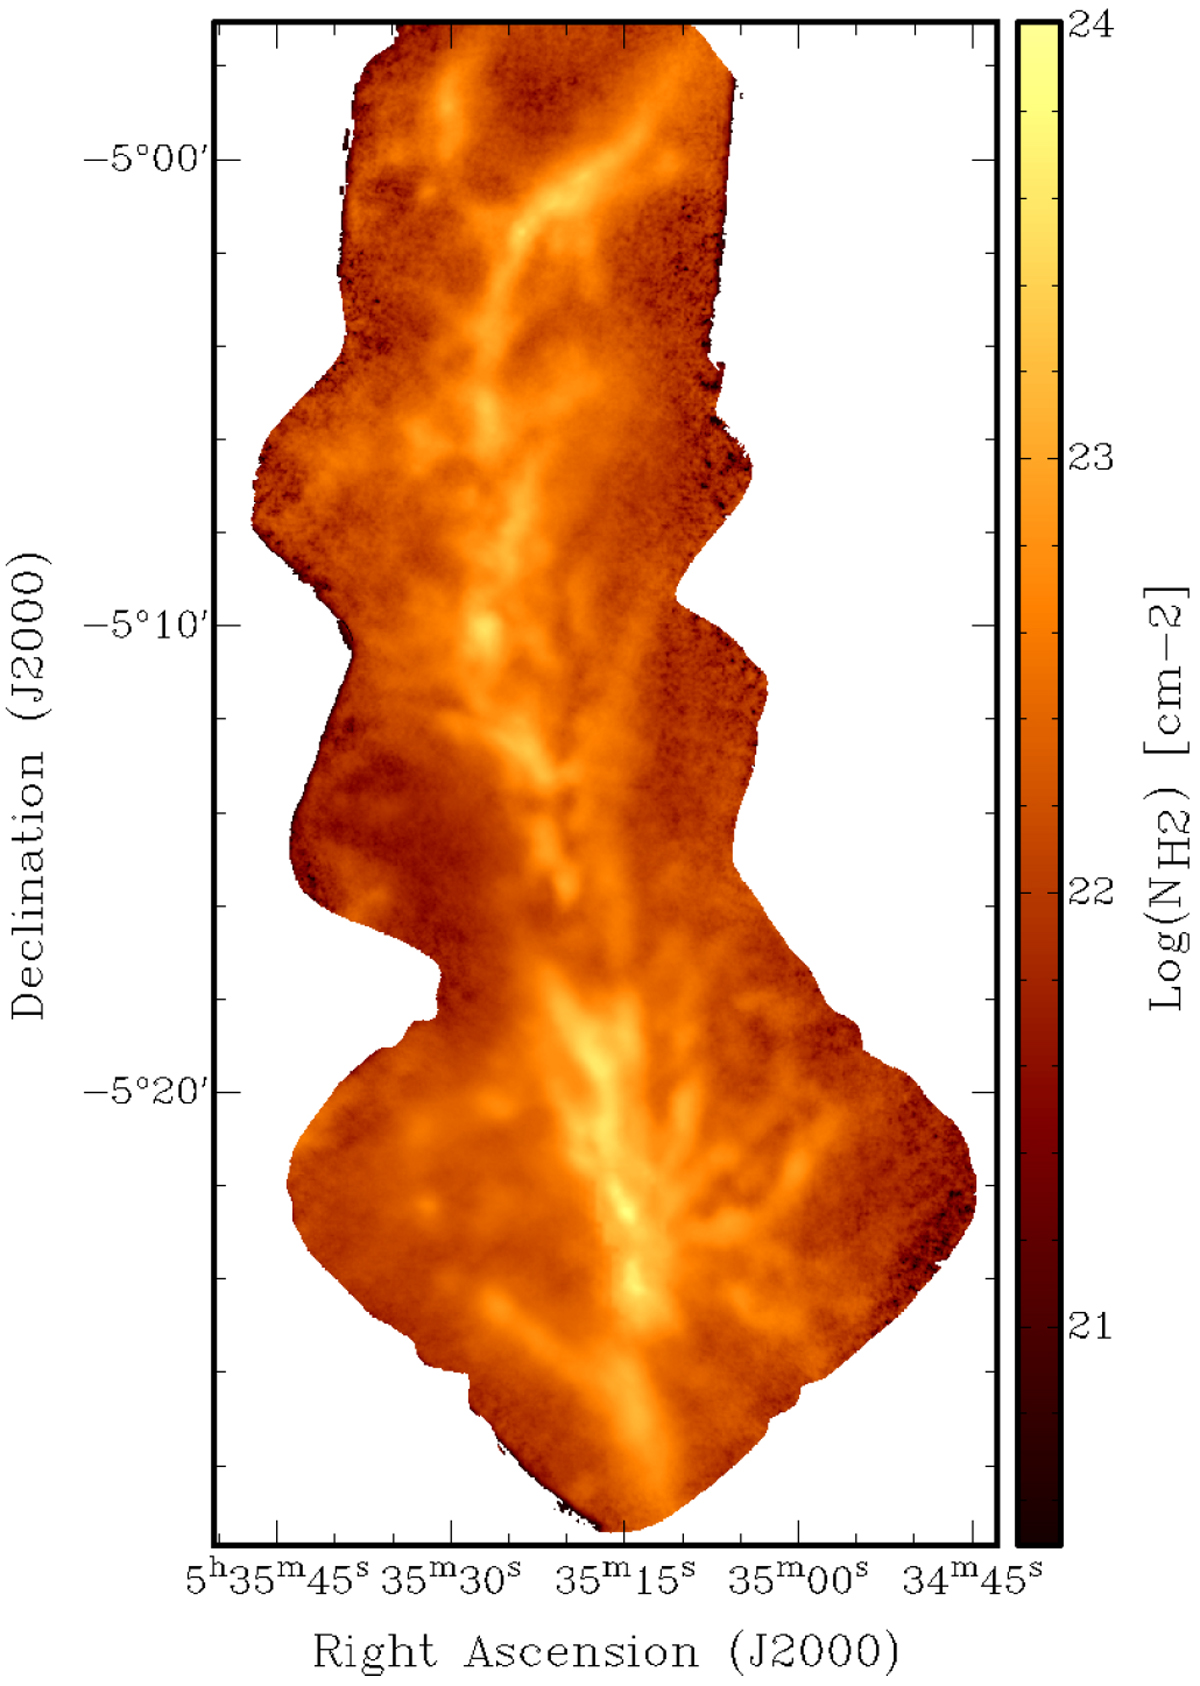
Column density map at ~8′′ resolution, derived from the 350 μm emission map and the temperature map shown in Fig. 2, assuming the uniform dust opacity law given by Eq. (1) (see text fordetails).
Current usage metrics show cumulative count of Article Views (full-text article views including HTML views, PDF and ePub downloads, according to the available data) and Abstracts Views on Vision4Press platform.
Data correspond to usage on the plateform after 2015. The current usage metrics is available 48-96 hours after online publication and is updated daily on week days.
Initial download of the metrics may take a while.