Fig. C.1
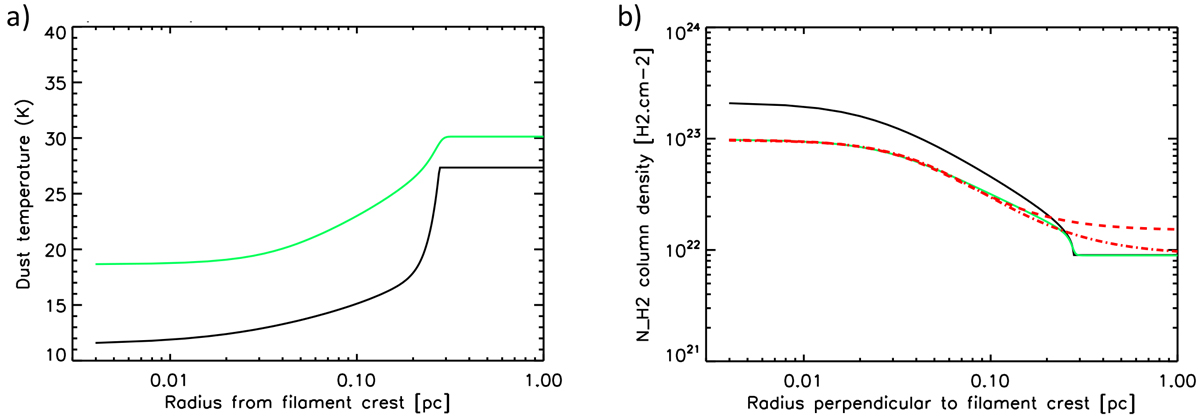
Synthetic dust temperature (a) and column density (b) profiles of a model filament with Plummer-type density structure, illustrating the effect of temperature gradients along the line of sight. The true dust opacity law and the dust opacity law adopted to derive temperature and column density maps from synthetic emission maps were identical and given by Eq. (1). (a) Comparison between the intrinsic model temperature profile as a function of radius (black curve) and the temperature profile as a function of projected radius resulting from SED fitting and thus averaging along the line of sight (green curve). (b) Comparison between the corresponding model column density profile (black curve) and the column density profile resulting from SED fitting (green curve). The dashed and dash-dotted red curves represent two Plummer fits to the SED column density profile, which differ only from each other and from the model in the outer regions.
Current usage metrics show cumulative count of Article Views (full-text article views including HTML views, PDF and ePub downloads, according to the available data) and Abstracts Views on Vision4Press platform.
Data correspond to usage on the plateform after 2015. The current usage metrics is available 48-96 hours after online publication and is updated daily on week days.
Initial download of the metrics may take a while.