Fig. 12
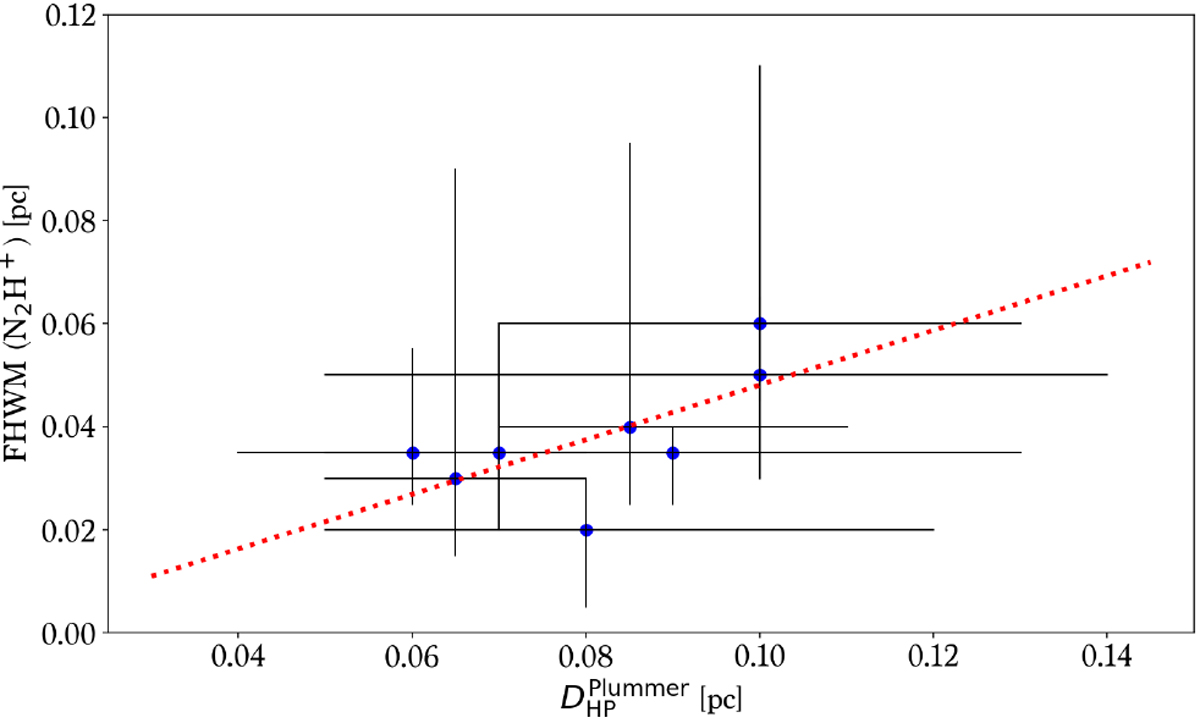
Comparison between the inner widths (![]() ) measured onthe high-resolution column density map (Fig. 3) and the FWHM fitted on the associated fibres seen in N2H+. Each point is located at the average of the
) measured onthe high-resolution column density map (Fig. 3) and the FWHM fitted on the associated fibres seen in N2H+. Each point is located at the average of the ![]() values measured eastwards and westwards of the crest vs. the median value of the fibre’s distribution of FWHMs. The error bars indicate the full range of values on both axes. The dotted red line shows the position of a linear fit to the data.
values measured eastwards and westwards of the crest vs. the median value of the fibre’s distribution of FWHMs. The error bars indicate the full range of values on both axes. The dotted red line shows the position of a linear fit to the data.
Current usage metrics show cumulative count of Article Views (full-text article views including HTML views, PDF and ePub downloads, according to the available data) and Abstracts Views on Vision4Press platform.
Data correspond to usage on the plateform after 2015. The current usage metrics is available 48-96 hours after online publication and is updated daily on week days.
Initial download of the metrics may take a while.