Open Access
Fig. 11
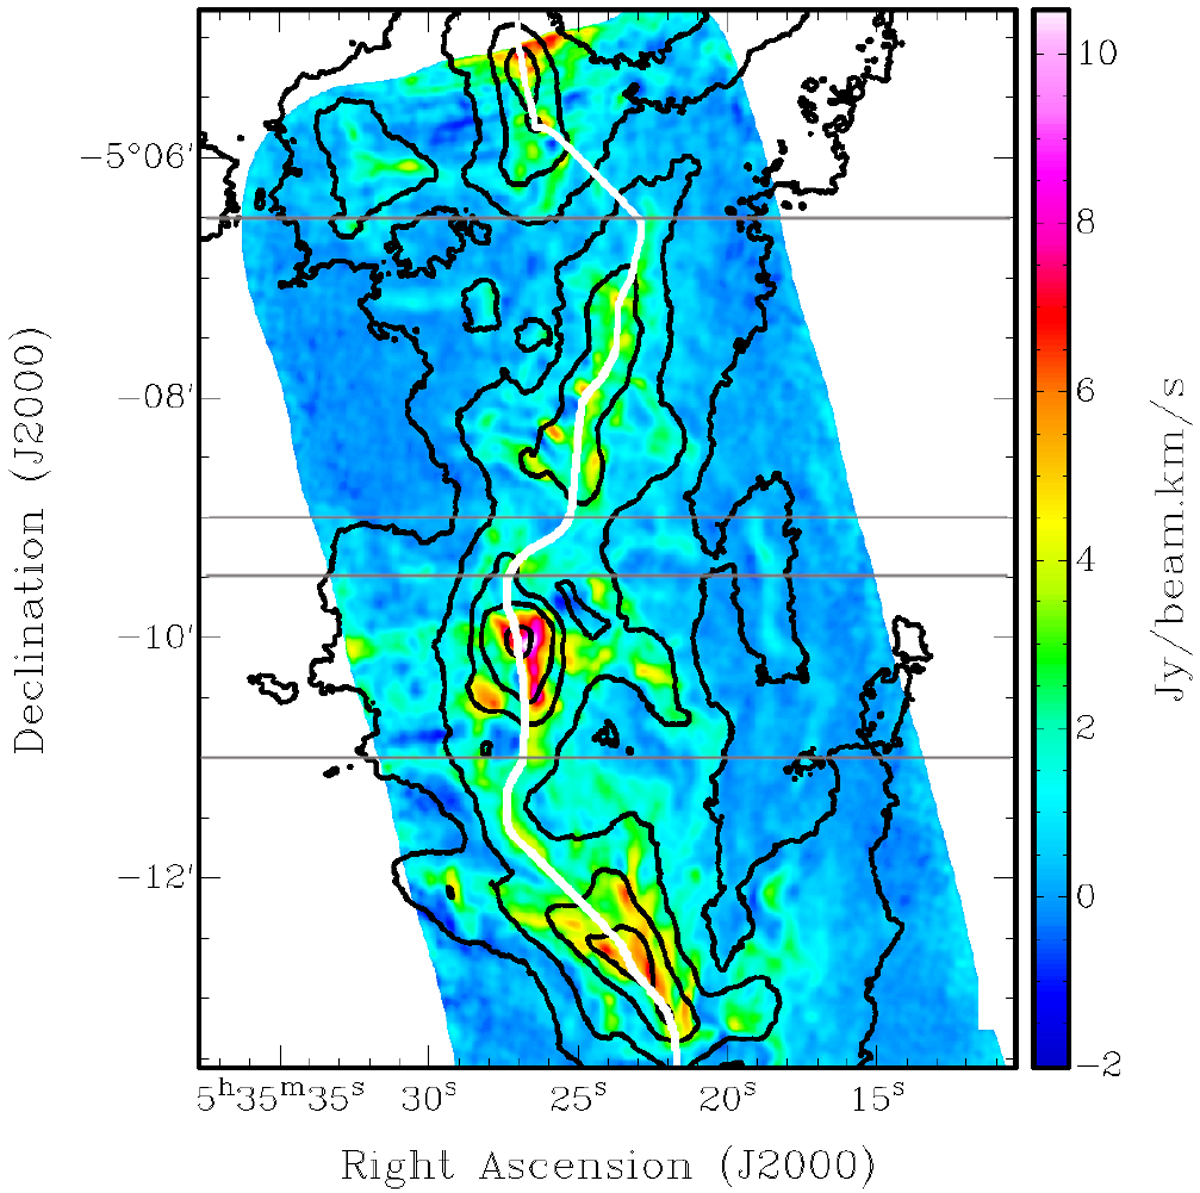
ALMA N2H+ moment-0 map (from Hacar et al. 2018) overlaid with our H2 column density map (black contours) for the ISF-OMC-2 region. The thick white line shows the crest of the filament extracted with DisPerSE. The thin horizontal lines indicate the limits of the various segments discussed in Sect. 4.2.1.
Current usage metrics show cumulative count of Article Views (full-text article views including HTML views, PDF and ePub downloads, according to the available data) and Abstracts Views on Vision4Press platform.
Data correspond to usage on the plateform after 2015. The current usage metrics is available 48-96 hours after online publication and is updated daily on week days.
Initial download of the metrics may take a while.