Open Access
Fig. 1
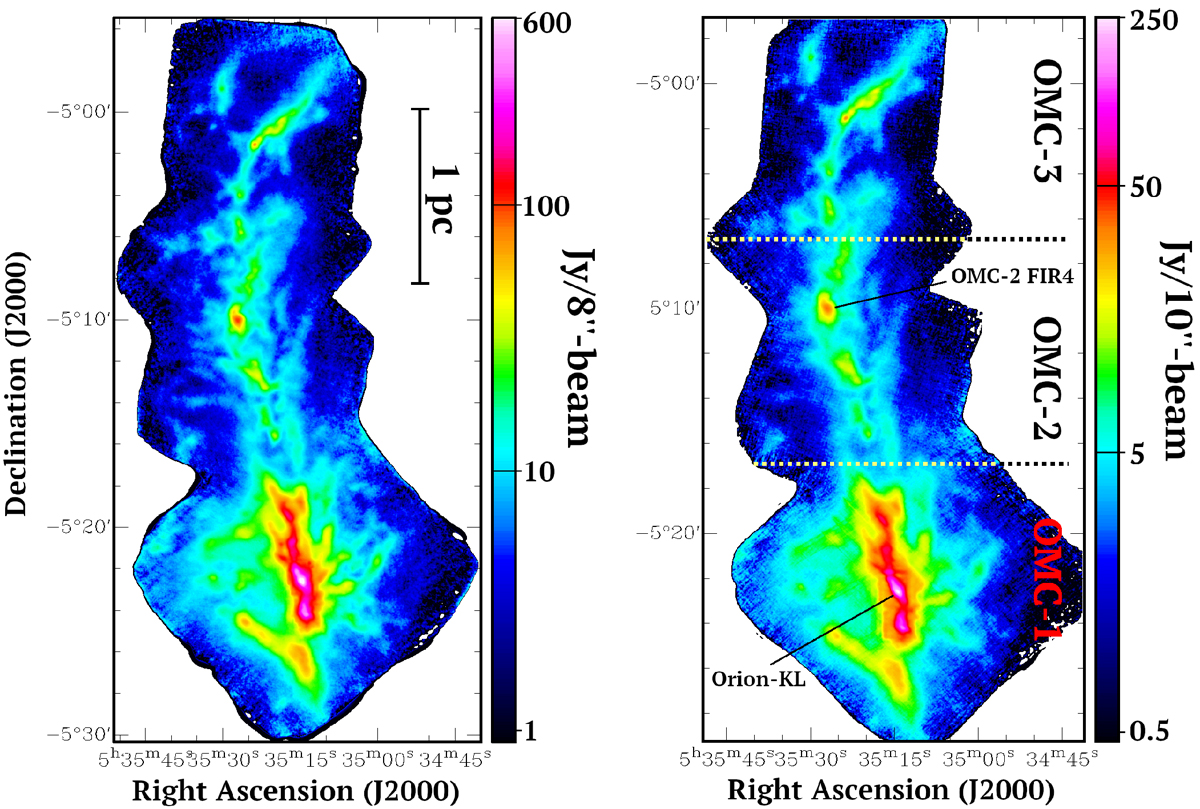
ArTéMiS maps at 350 μm combined with Herschel-SPIRE data at 350 μm (left) and ArTéMiS maps at 450 μm combined with Herschel-SPIRE data at 500 μm (right), shown in logarithmic colour scale. Some regions discussed in the text are indicated in the right panel.
Current usage metrics show cumulative count of Article Views (full-text article views including HTML views, PDF and ePub downloads, according to the available data) and Abstracts Views on Vision4Press platform.
Data correspond to usage on the plateform after 2015. The current usage metrics is available 48-96 hours after online publication and is updated daily on week days.
Initial download of the metrics may take a while.