Fig. 3.
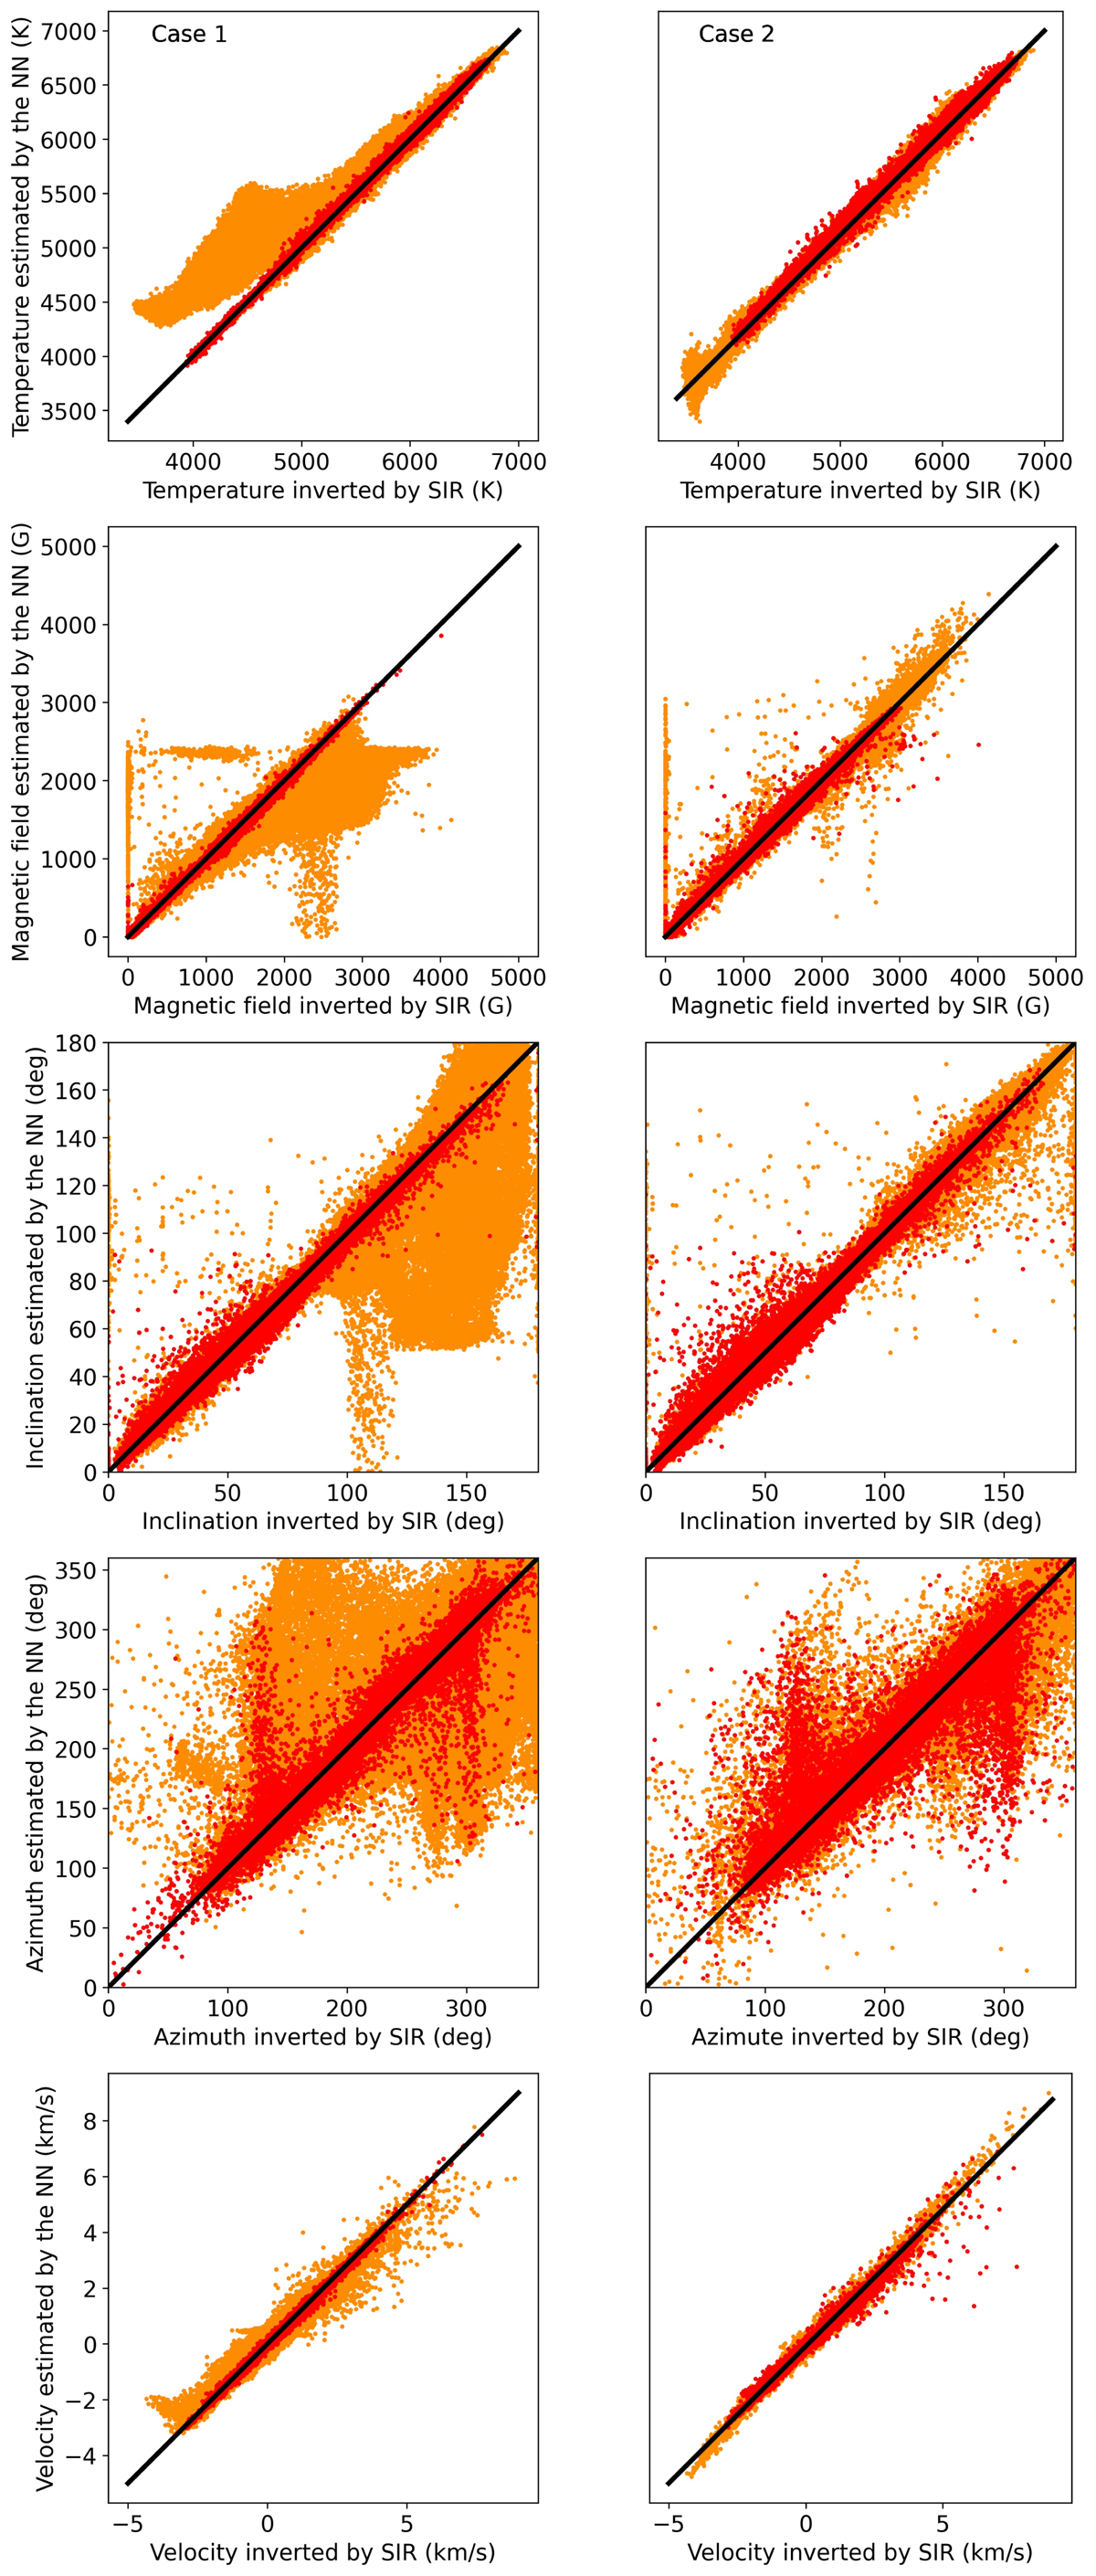
Comparison between the CNN estimation of the temperature, the line-of-sight velocity, and the magnetic field strength, inclination, and azimuth over the whole map using the different training scenarios and the reference inversion. The red dots correspond to pixels present in the red box in Fig. 1. The orange dots correspond to pixels outside the red box.
Current usage metrics show cumulative count of Article Views (full-text article views including HTML views, PDF and ePub downloads, according to the available data) and Abstracts Views on Vision4Press platform.
Data correspond to usage on the plateform after 2015. The current usage metrics is available 48-96 hours after online publication and is updated daily on week days.
Initial download of the metrics may take a while.