Fig. 6
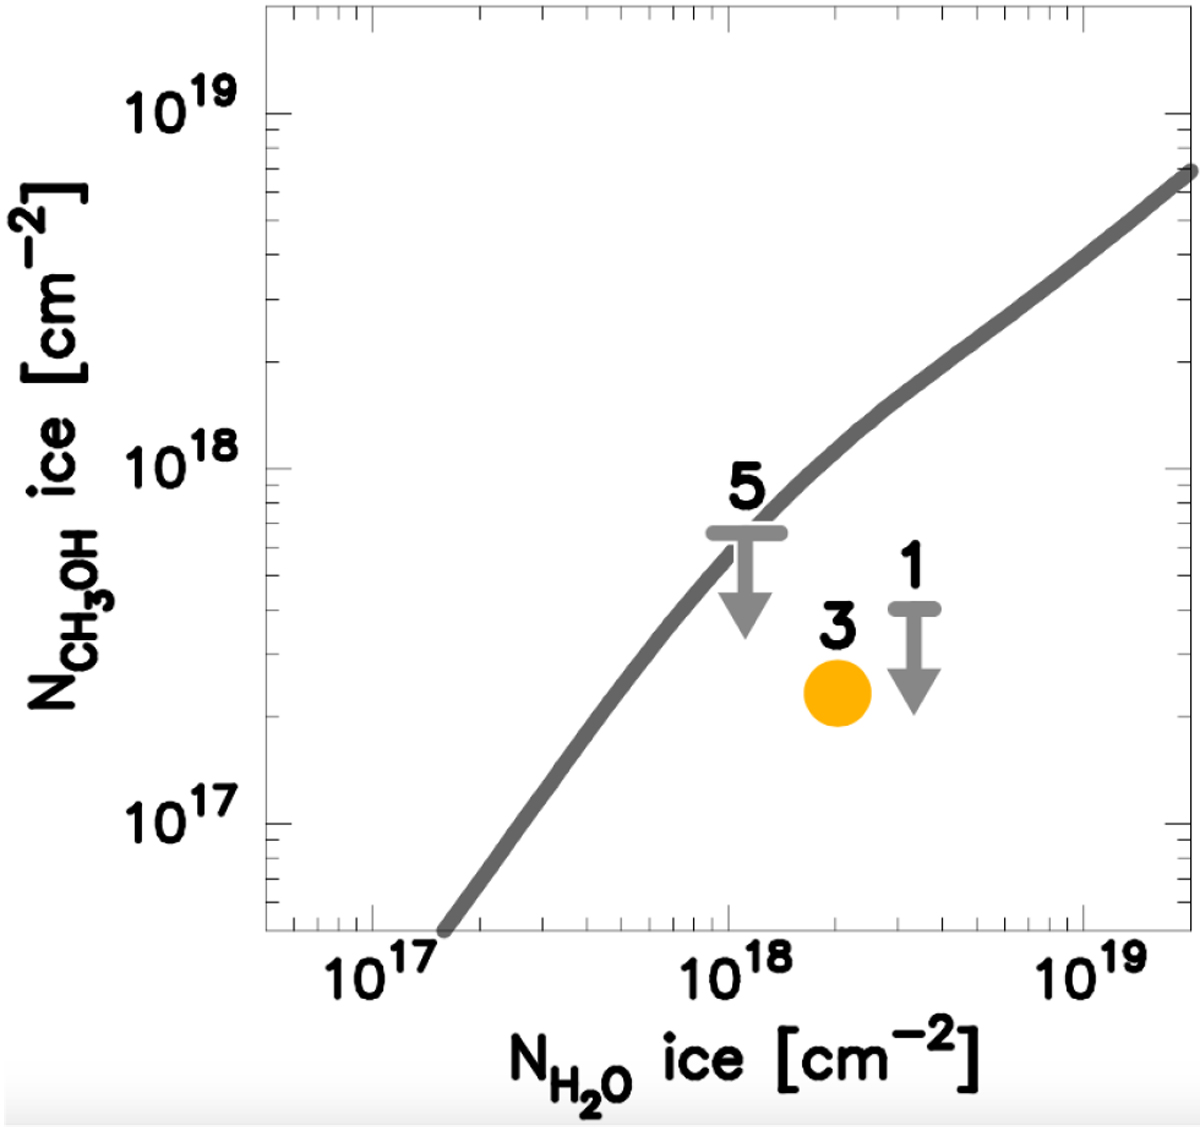
Column density of methanol ice plotted against that of water ice. The gray curve represents the model calculated by Vasyunin et al. (2017) with the updated radial density profile and the reduced initial oxygen abundance (see details in the text). The methanol-ice column density on source 3 is shown with a yellow circle. Theuncertainty in the column densities is smaller than the size of the symbol. The upper limits on sources 1 and 5 are shown by downward arrows. The extent of the horizontal bars denotes the uncertainty in
![]() . The methanol ice detected on source 3 and the upper limit set on source 1 are smaller than the values predicted by the model by factors of 5.0 and 4.1, respectively.
. The methanol ice detected on source 3 and the upper limit set on source 1 are smaller than the values predicted by the model by factors of 5.0 and 4.1, respectively.
Current usage metrics show cumulative count of Article Views (full-text article views including HTML views, PDF and ePub downloads, according to the available data) and Abstracts Views on Vision4Press platform.
Data correspond to usage on the plateform after 2015. The current usage metrics is available 48-96 hours after online publication and is updated daily on week days.
Initial download of the metrics may take a while.