Fig. 5
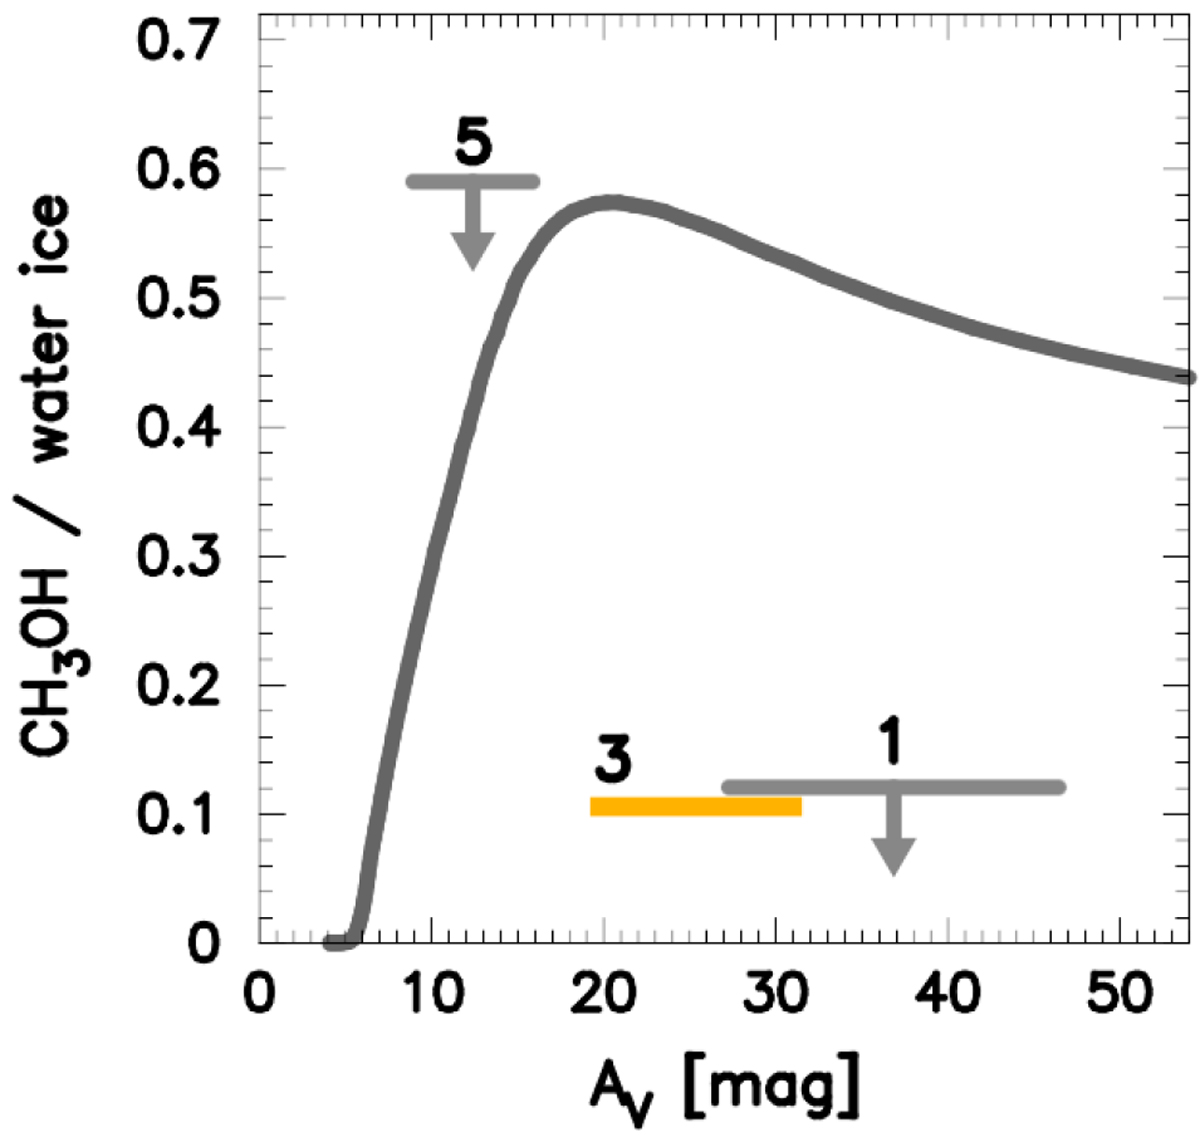
Fraction of methanol-ice with respect to water-ice column density plotted as a function of the visual extinction AV along the line of sight through the cloud. The gray curve shows the model calculations by Vasyunin et al. (2017) with an updated radial density profile and a reduced initial oxygen abundance (see text for details). The methanol to water-ice ratio observed on source 3 is marked by a horizontal yellow line, which denotes the full range of AV measured by the different methods. The upper limits on the methanol-ice abundance are shown with downward arrows in light grayfor sources 1 and 5. The fraction of methanol ice detected toward star 3 is 4.5 times smaller than predicted by the models.
Current usage metrics show cumulative count of Article Views (full-text article views including HTML views, PDF and ePub downloads, according to the available data) and Abstracts Views on Vision4Press platform.
Data correspond to usage on the plateform after 2015. The current usage metrics is available 48-96 hours after online publication and is updated daily on week days.
Initial download of the metrics may take a while.