Fig. 4
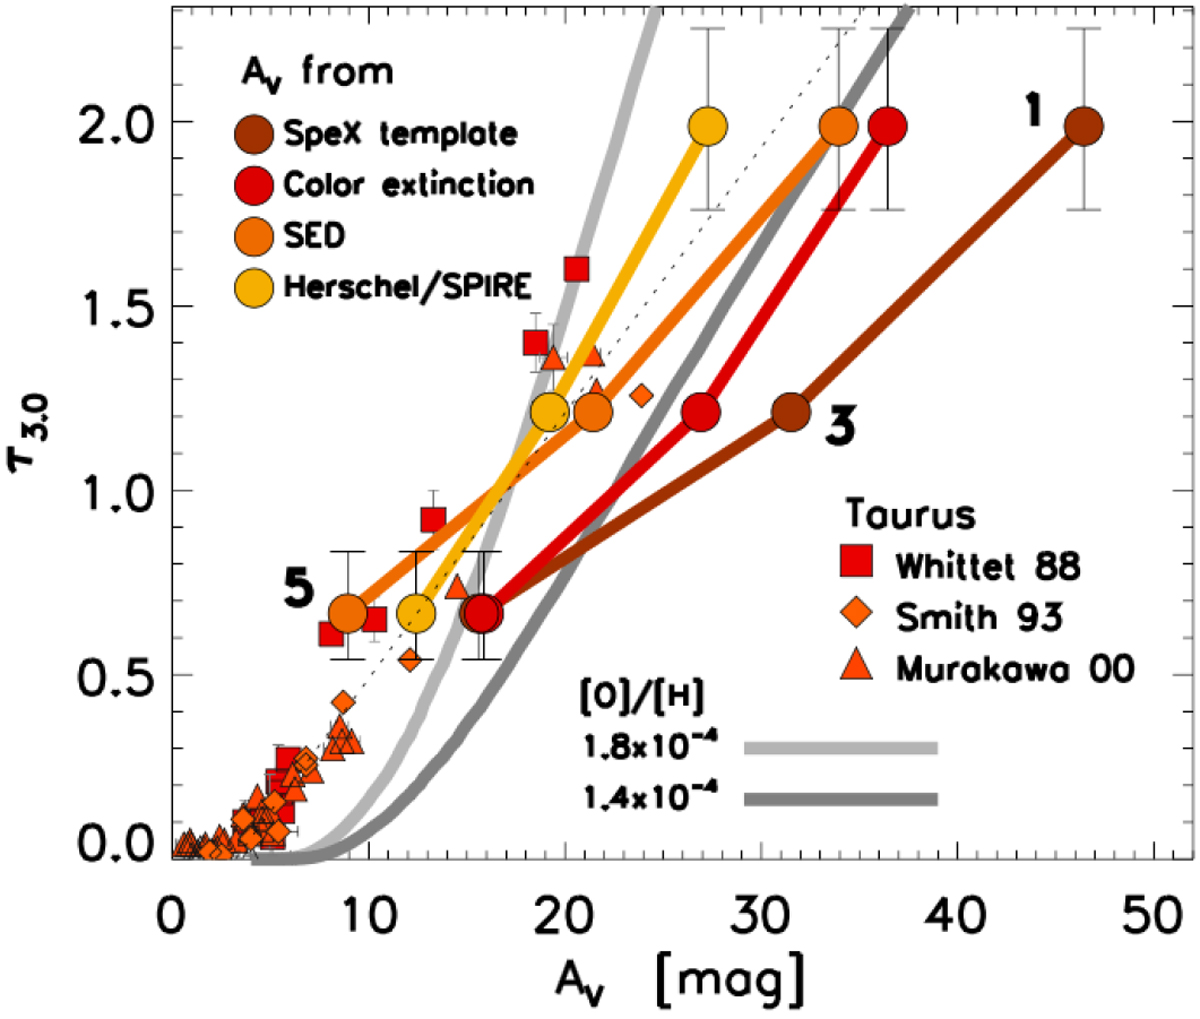
Peak optical depth of water ice at 3.0 μm in L 1544 plotted against the visual extinction (AV) toward the sources. AV was measured in four different ways: by comparing the object spectrum with the IRTF spectral library (dark red circles), from the extinction map constructed by the colors of reddened background stars (red circles), by comparing the object SEDs with the stellar photospheric model (orange circles), and from the dust column density calculated based on the far-infrared thermal emission of dust observed by Herschel/SPIRE (yellow circles). The optical depths of water ice on the sources in the Taurus Molecular Cloud are shown for comparison (red symbols). The references are Whittet et al. (1988), Smith et al. (1993), and Murakawa et al. (2000). The dashed line denotes the AV – τ3.0 relation known in Taurus (Whittet et al. 2001). The range of AV for each science source measured in different techniques is 50–100%. The peak optical depths of water ice in L 1544 are in the range between being consistent with and smaller than those in Taurus. The gray lines represent the model calculation by Vasyunin et al. (2017) with standard low-metal abundance of oxygen ([O]/[H] = 1.8 × 10⁻⁴; light gray) and a reduced oxygen abundance (1.4 × 10⁻⁴; dark gray).
Current usage metrics show cumulative count of Article Views (full-text article views including HTML views, PDF and ePub downloads, according to the available data) and Abstracts Views on Vision4Press platform.
Data correspond to usage on the plateform after 2015. The current usage metrics is available 48-96 hours after online publication and is updated daily on week days.
Initial download of the metrics may take a while.