Fig. 3
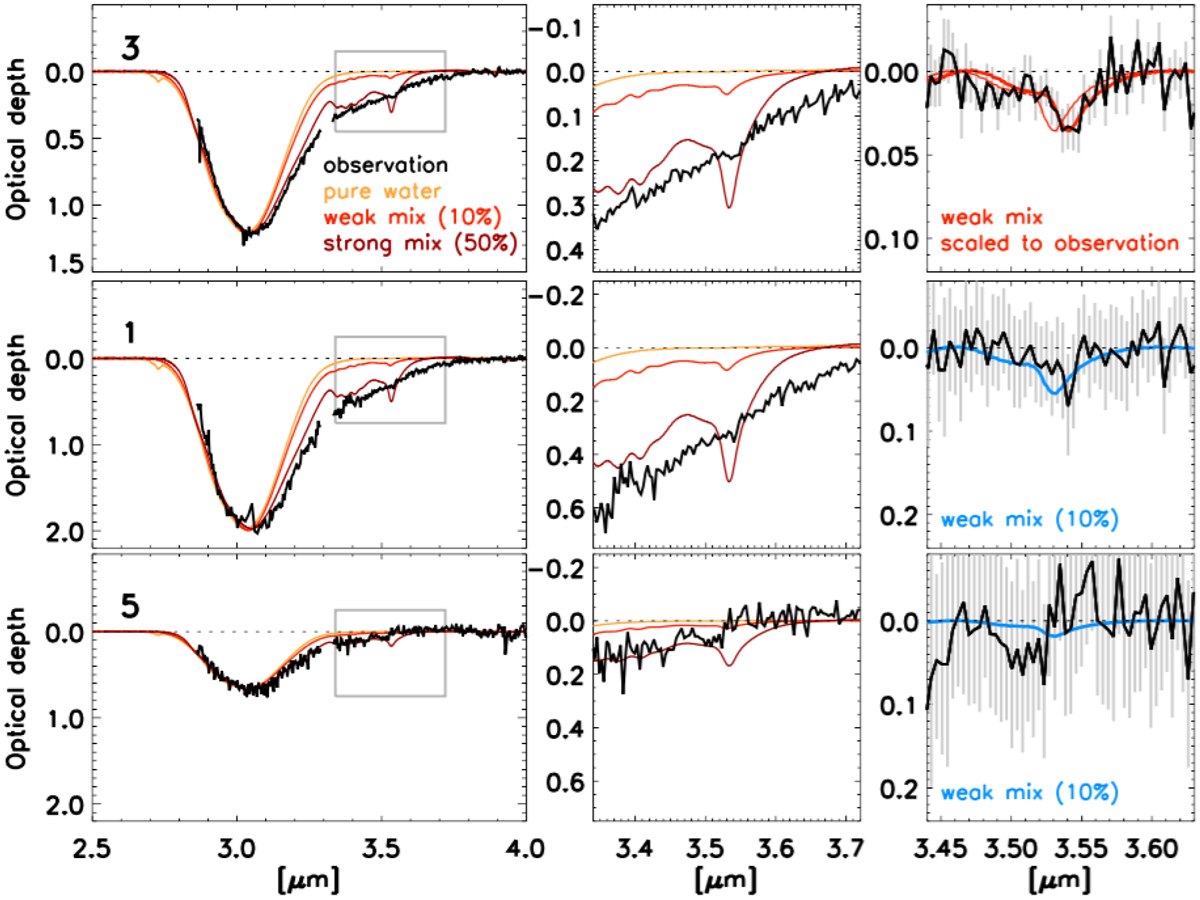
Optical depth spectra obtained toward the three stars located behind L 1544, shown in order of visual extinction. The optical depth is measured with respect to the matching template spectra chosen from the IRTF spectral library (Rayner et al. 2009). Source labels are the same as in Fig. 1. The atmospheric transmission is low at the wavelengths between 2.50–2.85 μm and 3.29–3.31 μm because of the telluric water and methane absorption, respectively. The data in these intervals are removed from the presentation. Left panel in the top row: spectrum of star 3 (black) compared to the laboratory ice spectra from Hudgins et al. (1993). The pure water ice spectrum is shown in yellow, the interstellar weak mix (H2O:CH3OH:CO:NH3 = 100:10:1:1) in orange, and the interstellar strong mix, 100:50:1:1, in red. Middle panel: zoomed view of the left panelwithin the gray rectangle. Right panel: comparison of astronomical (black) and laboratory (red) spectra after the local continua were subtracted. The laboratory spectrum of methanol ice is scaled so that the absorption peak matches the observation. The thick red trace is shifted by 0.01 μm from the laboratory measurement (thin trace). Middle and bottom rows: same as the top row, but for sources 1 and 5, respectively.The methanol ice absorption feature is not detected.
Current usage metrics show cumulative count of Article Views (full-text article views including HTML views, PDF and ePub downloads, according to the available data) and Abstracts Views on Vision4Press platform.
Data correspond to usage on the plateform after 2015. The current usage metrics is available 48-96 hours after online publication and is updated daily on week days.
Initial download of the metrics may take a while.