Fig. 2
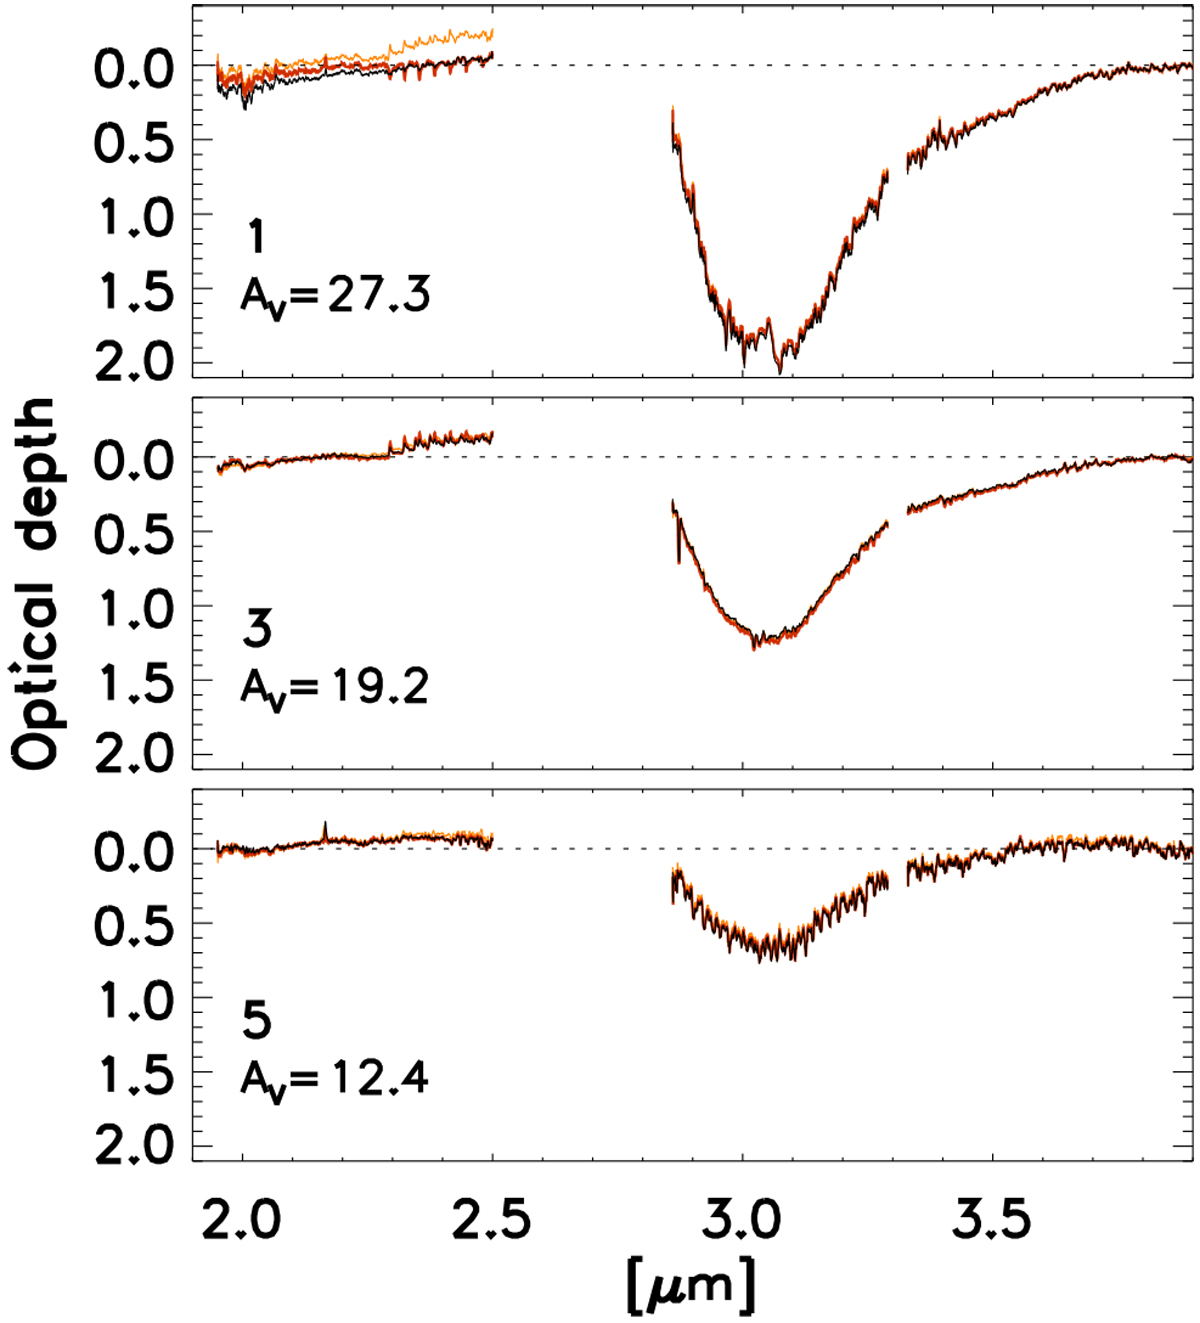
Optical depth spectra of three sources behind L 1544 shown in the order of visual extinction. The optical depth is measured with respect to the matching template spectra chosen from the IRTF spectral library (Rayner et al. 2009). The spectra reduced with three best-matching templates are shown (black, orange, and yellow traces in the order of goodness of matching). The identification of the sources is the same as in Fig. 1. The atmospheric transmission is low at the wavelengths 2.50–2.85 μm and 3.29–3.31 μm because of the telluric water and methane absorption, respectively. The data in these intervals are removed from the presentation.
Current usage metrics show cumulative count of Article Views (full-text article views including HTML views, PDF and ePub downloads, according to the available data) and Abstracts Views on Vision4Press platform.
Data correspond to usage on the plateform after 2015. The current usage metrics is available 48-96 hours after online publication and is updated daily on week days.
Initial download of the metrics may take a while.