Fig. 7.
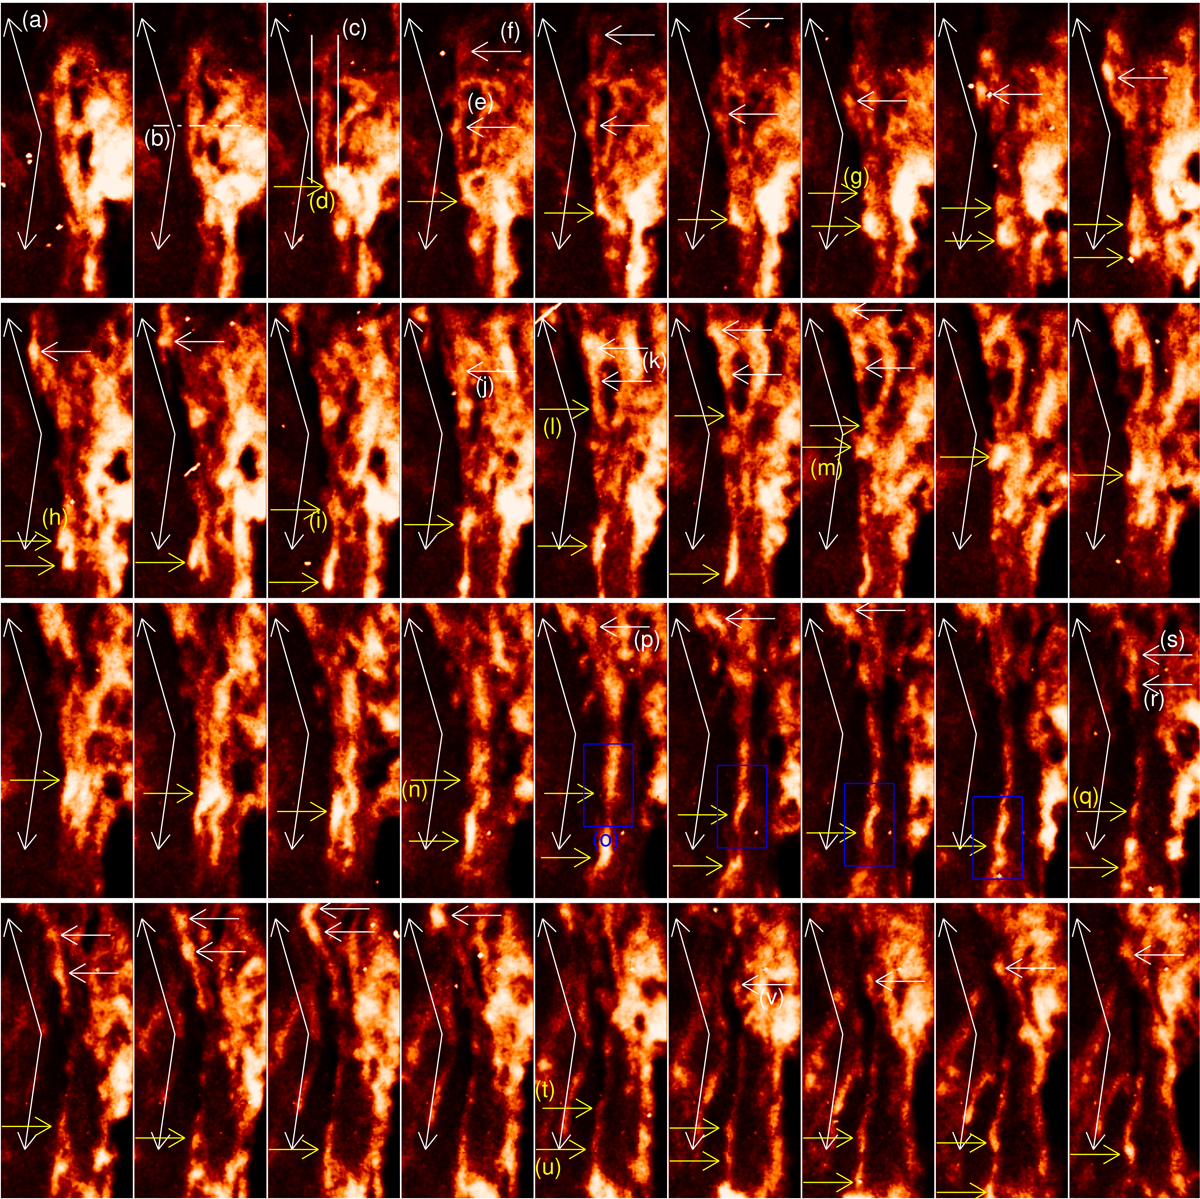
Multiple snapshots of the dynamic ejections. The white arrows marked (a) show the general direction of the approximately up-down motions. The position of the slit used in Fig. 8 is marked (b). What appears to be the initial plasma sheet is highlighted using the two white lines marked (c). A motion of some upwardly ejected blobs – (e), (f), (j), (k), (p), (r), (s) and (v) – and downwardly ejected blobs – (d), (g), (h), (i), (m), (n), (t) and (u) – are marked with white and yellow horizontal arrows respectively. The region inside the blue boxes marked (o) is used in Fig. 9. See online movie of this figure.
Current usage metrics show cumulative count of Article Views (full-text article views including HTML views, PDF and ePub downloads, according to the available data) and Abstracts Views on Vision4Press platform.
Data correspond to usage on the plateform after 2015. The current usage metrics is available 48-96 hours after online publication and is updated daily on week days.
Initial download of the metrics may take a while.