Fig. 4.
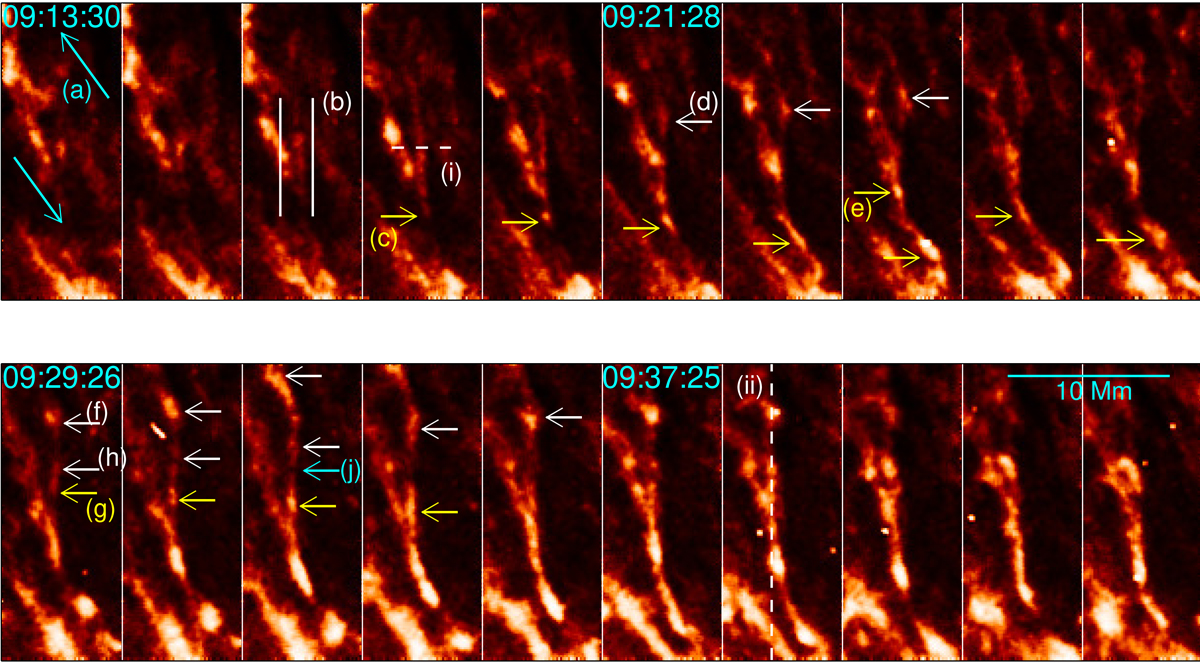
Multiple snapshots in sequence between 09:13:30 and 09:43:47 of the boxed region shown in Fig. 2. The arrows (marked with letters) highlight various dynamics. (a) Direction of the up and down flows in the prominence. (b) The lines delineate the plasma sheet that forms. (c) Ejection from the bottom of the plasma sheet. (d) Ejection from the top of the plasma sheet. (e) Downflow hits flows from plasma sheet and are deflected. (f) Upflow from plasma sheet is deflected and joins the background upflow. (g) Another downward ejection from plasma sheet. (h) Another upward ejection from plasma sheet. (j) a reduction of intensity in the region between the bi-directional ejections (g) and (h). Only the first arrow of any set is marked. The dashed lines marked (i) and (ii) show the positions of the slit used for measuring the plasma sheet width and the time-distance plot in Fig. 6, respectively. See online movie of this figure.
Current usage metrics show cumulative count of Article Views (full-text article views including HTML views, PDF and ePub downloads, according to the available data) and Abstracts Views on Vision4Press platform.
Data correspond to usage on the plateform after 2015. The current usage metrics is available 48-96 hours after online publication and is updated daily on week days.
Initial download of the metrics may take a while.