Fig. 2.
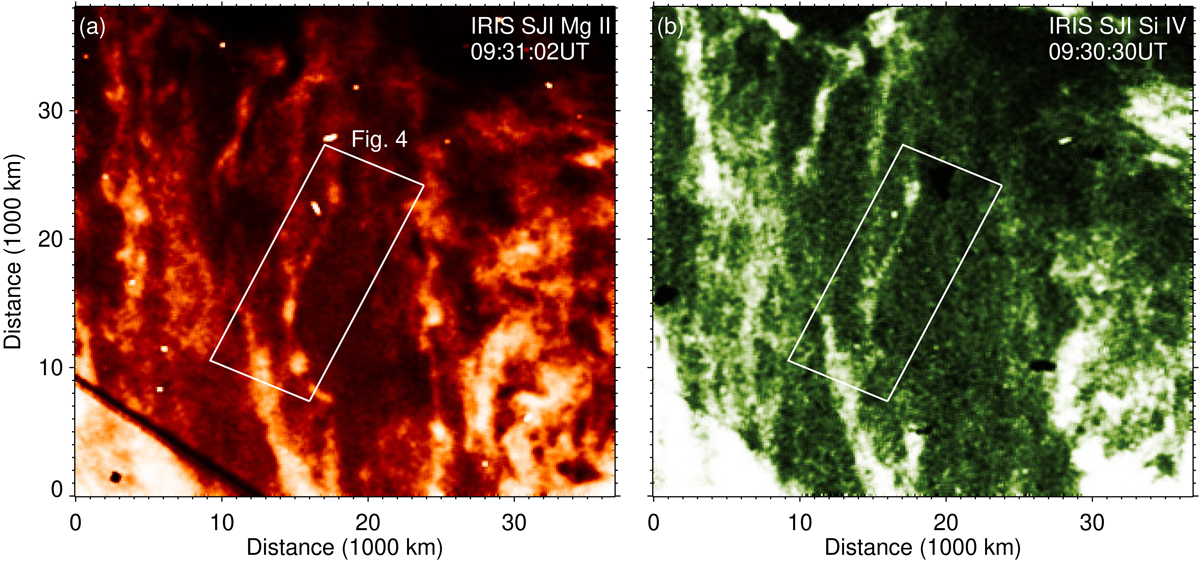
Closeup of the dynamic region at 09:31 UT (we note that the images in the figure have been rotated to set gravity to be in the downward direction). Panel a: Mg II intensity and panel b: Si IV intensity. The white box marks the area used in Fig. 4. The dark line shows the position of the IRIS slit. See online movie of this figure.
Current usage metrics show cumulative count of Article Views (full-text article views including HTML views, PDF and ePub downloads, according to the available data) and Abstracts Views on Vision4Press platform.
Data correspond to usage on the plateform after 2015. The current usage metrics is available 48-96 hours after online publication and is updated daily on week days.
Initial download of the metrics may take a while.