Fig. 8.
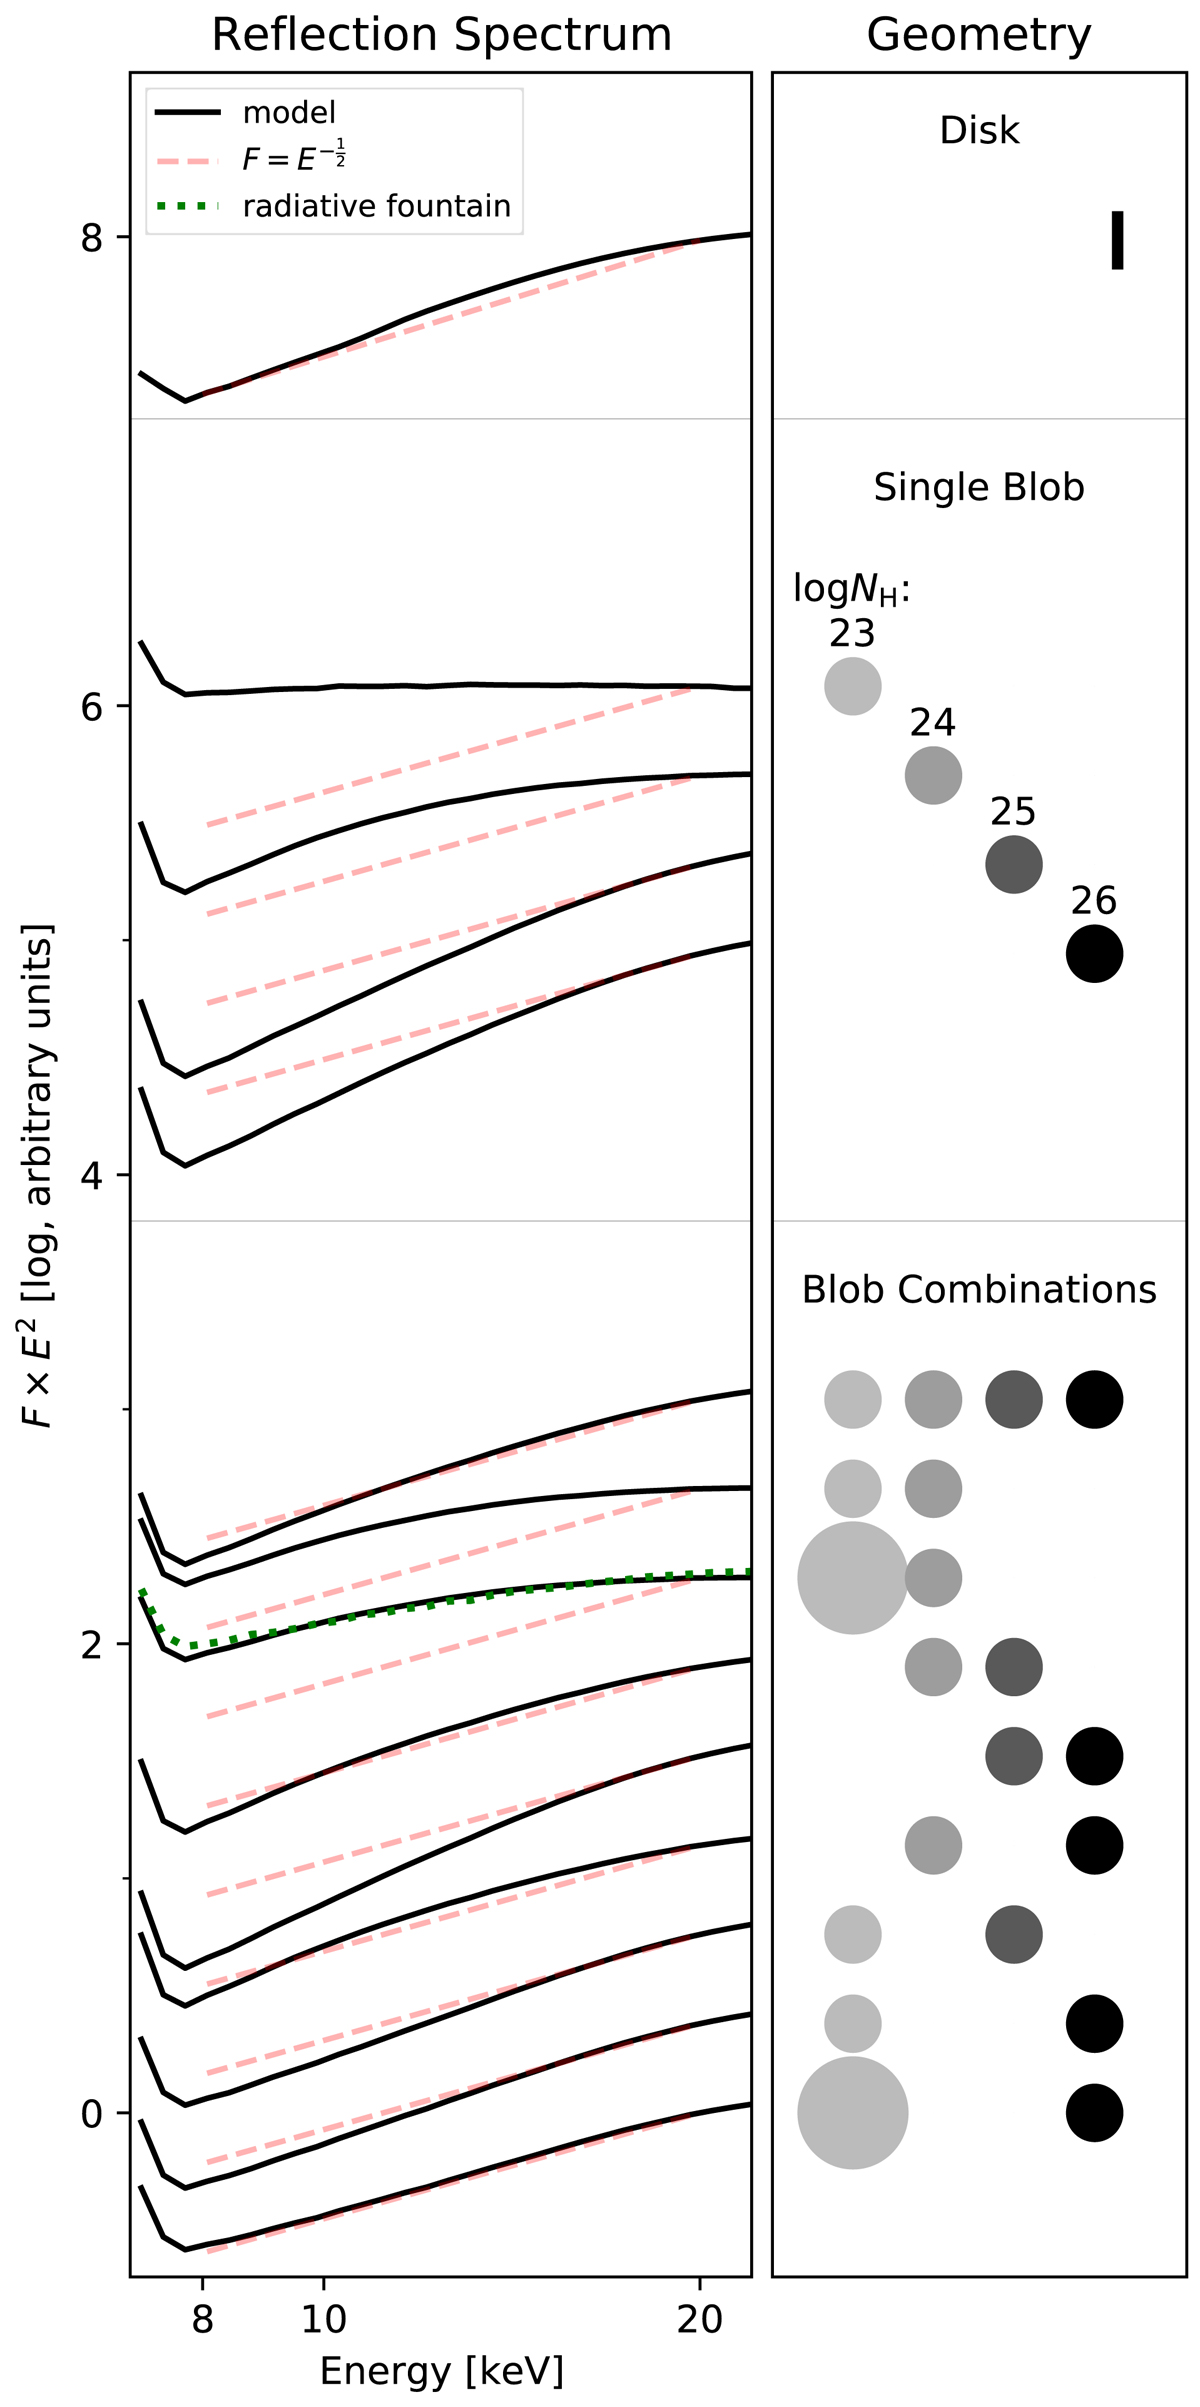
Reflection spectrum (left, black) for different geometries (right). Black curves are normalised at 20 keV, with offsets. The red dashed lines illustrate the observed power law. The top example shows reflection off a semi-infinite disk. The middle four examples show a single blob with column densities log NH = 23, 24, 25, and 26. In low-density blobs, the reflection extends to low energies, while for the densest blobs the spectrum rises rapidly (powerlaw photon index ≈0). The bottom examples show mixtures of the reflection spectra, assuming equal covering factors in all but the last. Mixtures have a wider Compton hump with a smooth bend. The exceptions are the bottom three examples, which lack the log NH = 24 blob. Their powerlaw-like spectrum approximately follows ![]() (red dashed line). The dotted green line shows the radiative fountain model.
(red dashed line). The dotted green line shows the radiative fountain model.
Current usage metrics show cumulative count of Article Views (full-text article views including HTML views, PDF and ePub downloads, according to the available data) and Abstracts Views on Vision4Press platform.
Data correspond to usage on the plateform after 2015. The current usage metrics is available 48-96 hours after online publication and is updated daily on week days.
Initial download of the metrics may take a while.