Fig. 4.
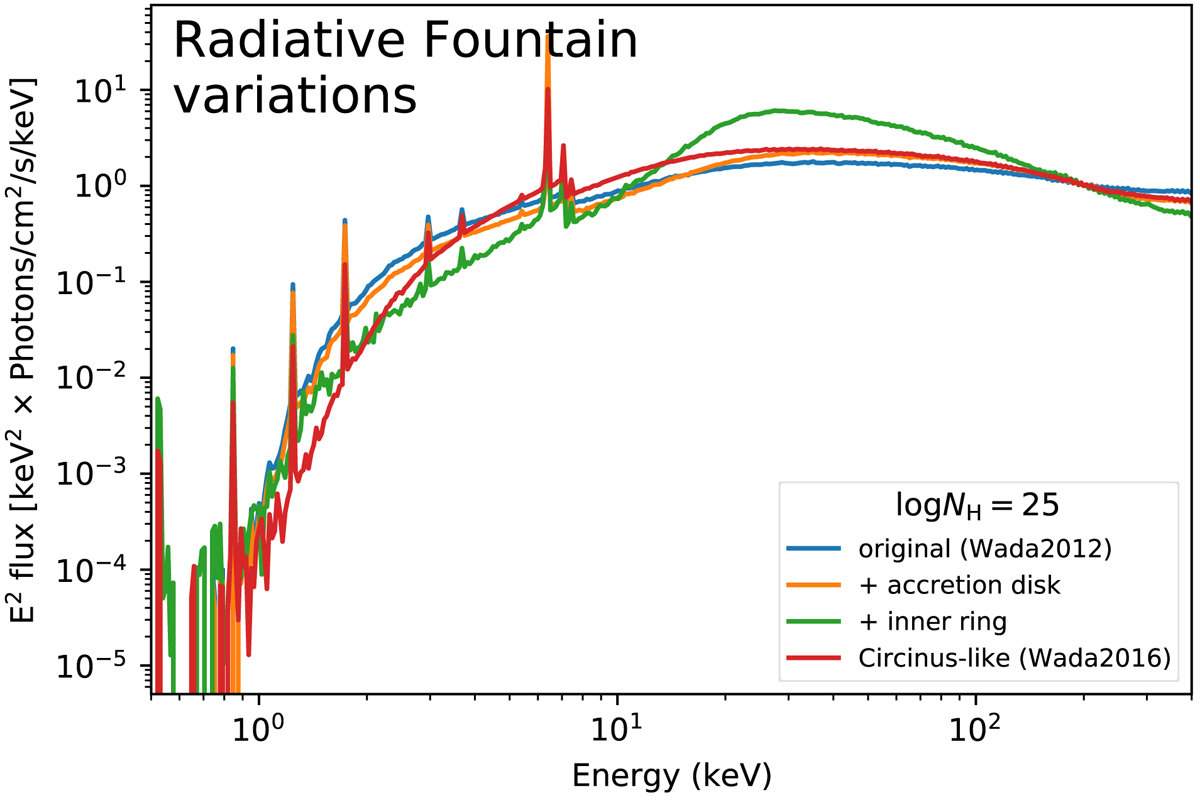
Variations of the radiative fountain model spectra. The Wada (2012) and Wada et al. (2016) models (blue and red, respectively) differ in black hole mass and supernova feedback. The orange curve includes reflection from an accretion disk. The green curve includes a Compton-thick ring around the central X-ray source, which leads to stronger emission in the 10−50 keV energy range than the original model (blue curve). Models are normalised at 200 keV.
Current usage metrics show cumulative count of Article Views (full-text article views including HTML views, PDF and ePub downloads, according to the available data) and Abstracts Views on Vision4Press platform.
Data correspond to usage on the plateform after 2015. The current usage metrics is available 48-96 hours after online publication and is updated daily on week days.
Initial download of the metrics may take a while.