Fig. B.1.
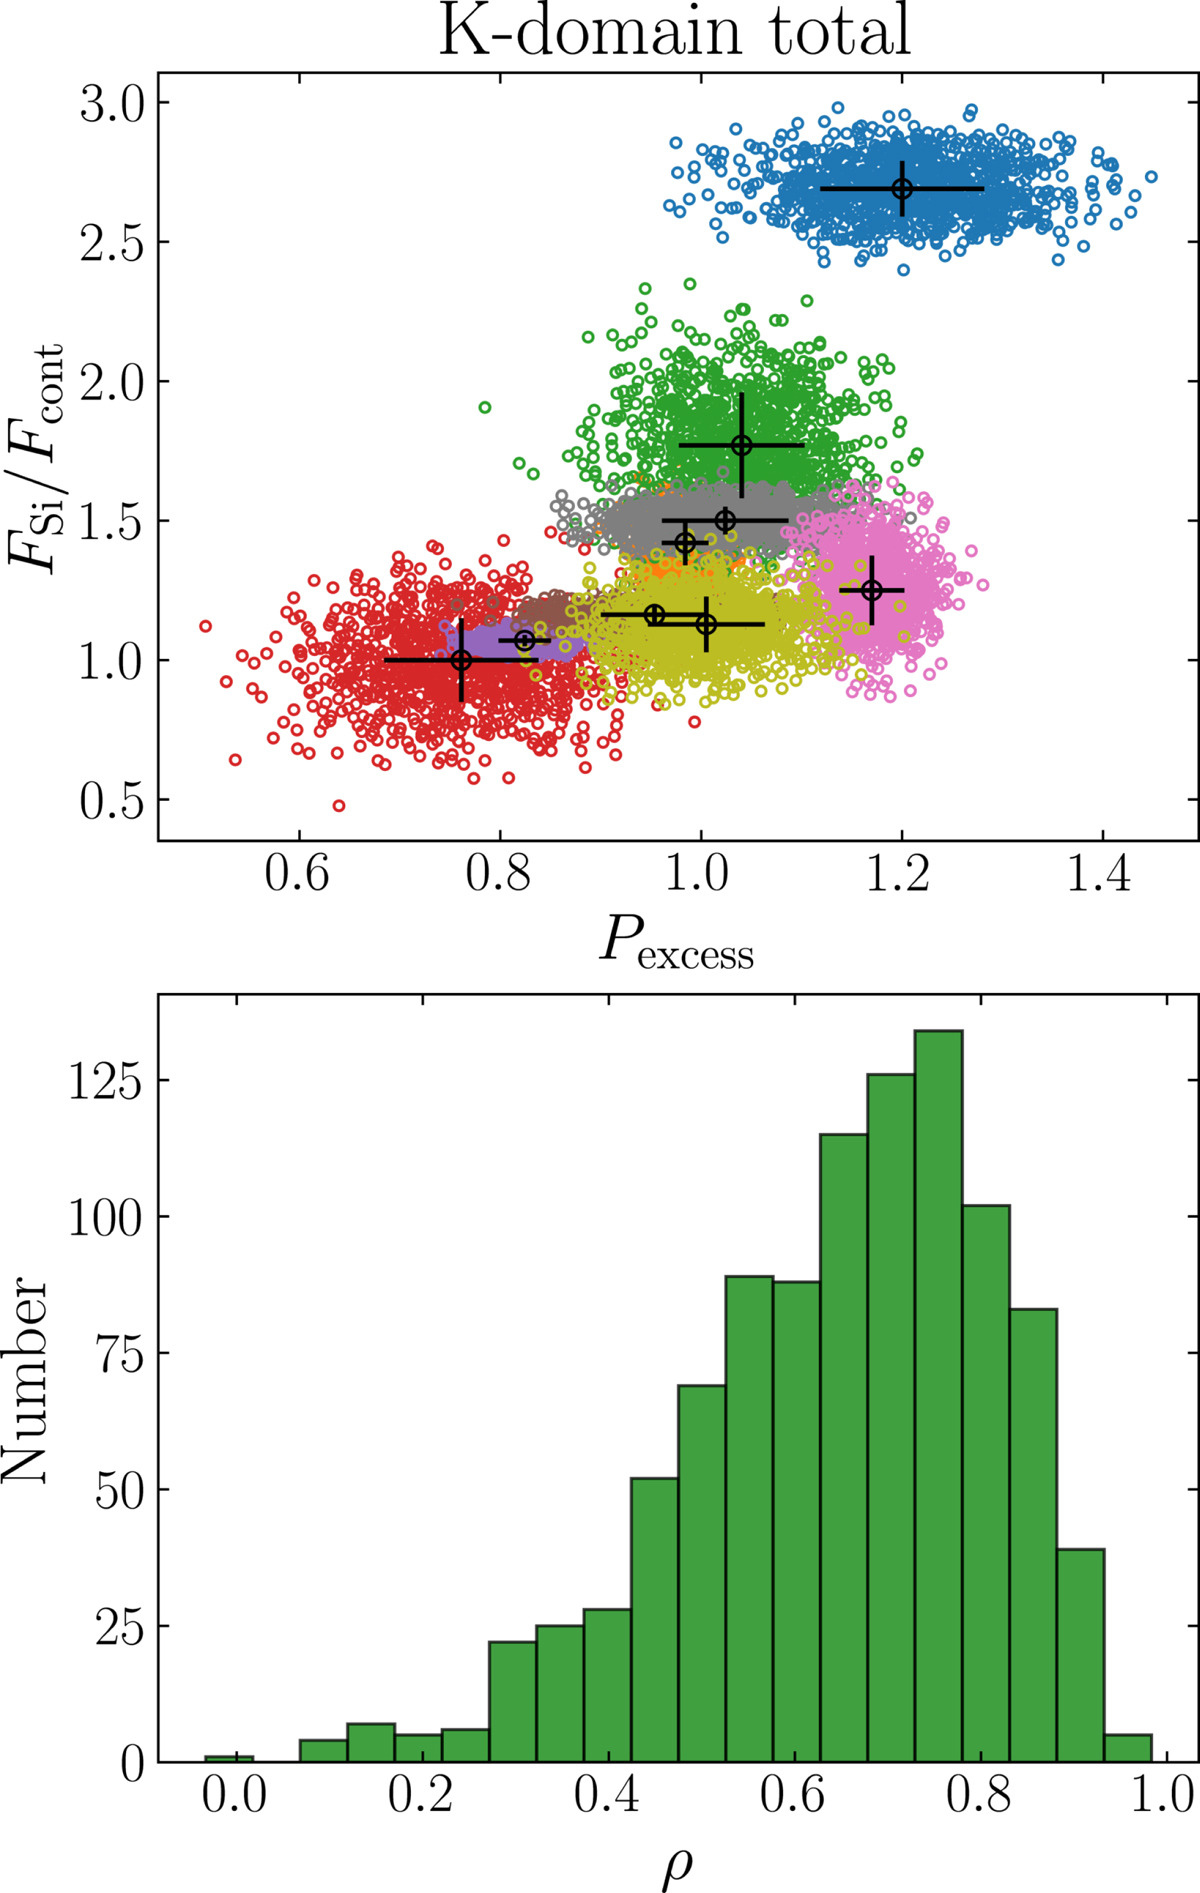
Number distribution of clones randomly generated in the Gaussian distribution whose standard deviation corresponds to the error bars of the two parameters of all comets in the K domain in Fig. 3a (a) and the histogram of the resultant Spearman’s rank correlation coefficient ρ of 1000 new samples retrieved from Monte Carlo simulations. Panel a: colours do not correspond with those in Fig. 3. Panel b: the median of the distribution function with the 68.2% interval around the median value is 0.71![]() , and its mode is 0.76.
, and its mode is 0.76.
Current usage metrics show cumulative count of Article Views (full-text article views including HTML views, PDF and ePub downloads, according to the available data) and Abstracts Views on Vision4Press platform.
Data correspond to usage on the plateform after 2015. The current usage metrics is available 48-96 hours after online publication and is updated daily on week days.
Initial download of the metrics may take a while.