Open Access
Fig. 1.
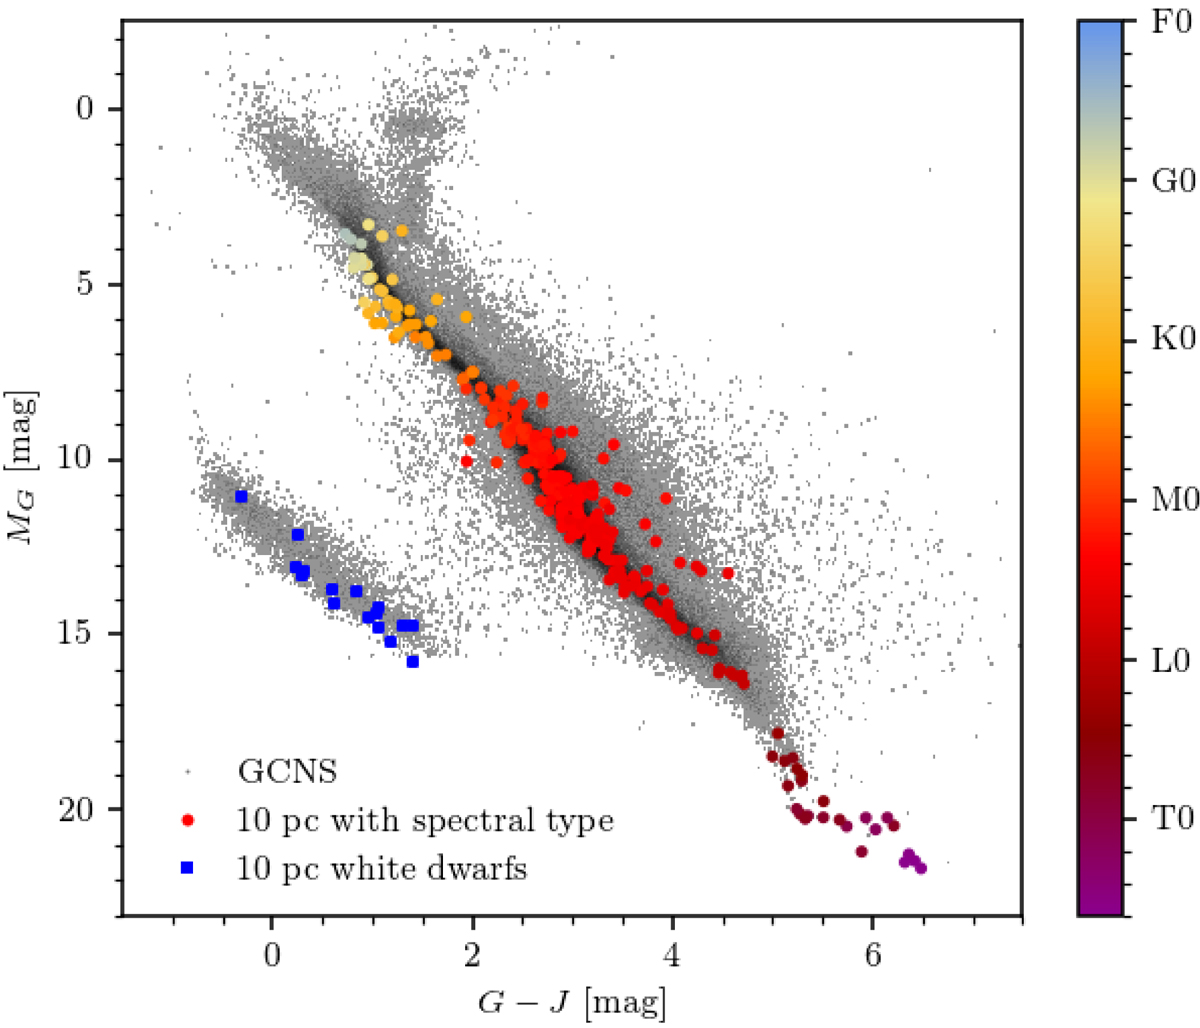
Colour-absolute magnitude diagram of the 10 pc sample, over-imposed on the GCNS (grey dots). The colour bar indicates the spectral type. White dwarfs are in dark blue.
Current usage metrics show cumulative count of Article Views (full-text article views including HTML views, PDF and ePub downloads, according to the available data) and Abstracts Views on Vision4Press platform.
Data correspond to usage on the plateform after 2015. The current usage metrics is available 48-96 hours after online publication and is updated daily on week days.
Initial download of the metrics may take a while.