Fig. 5.
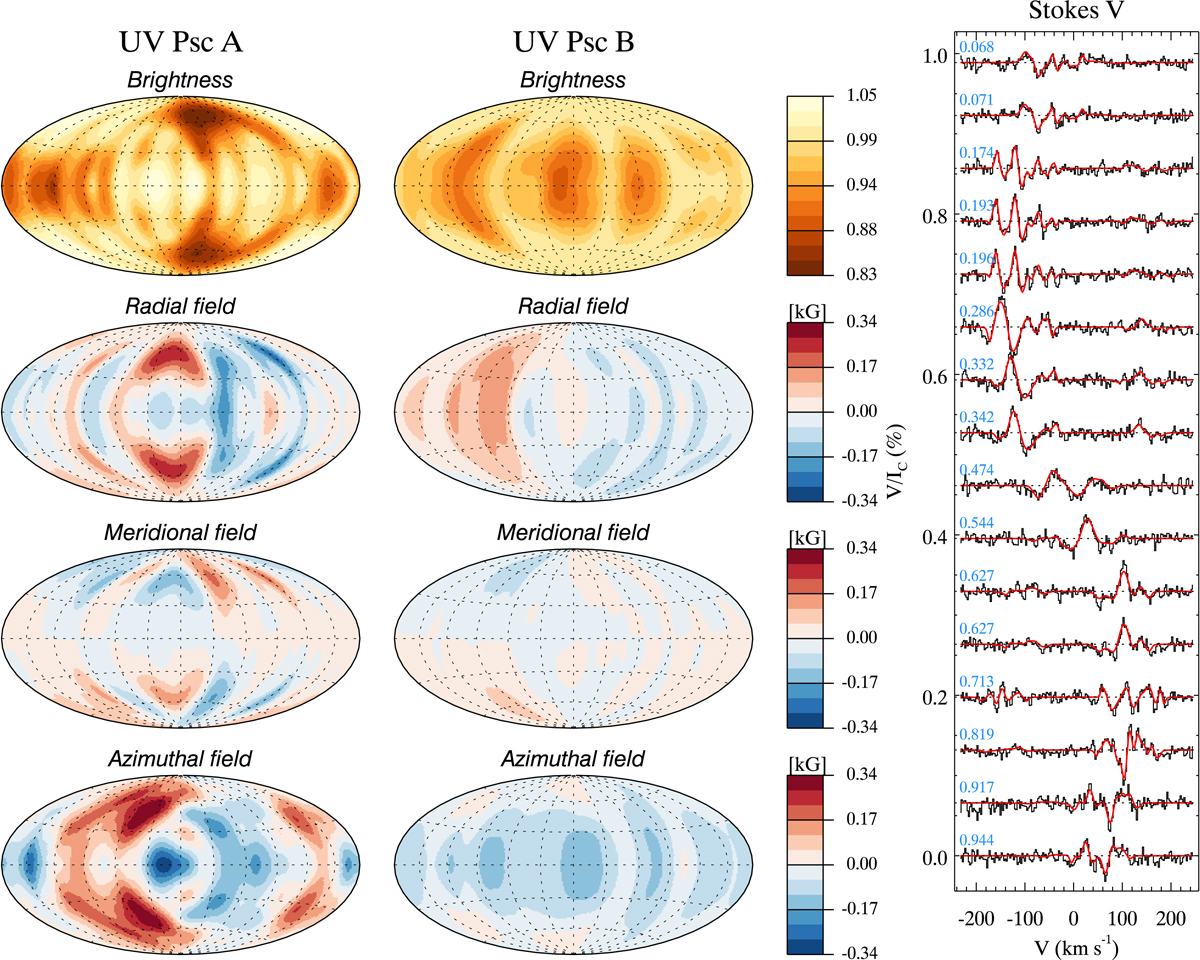
Left: maps of the brightness distribution (top row), obtained from the Stokes I spectra and the magnetic field components (row 2−4), obtained from the Stokes V spectra for UV Psc A (left column) and UV Psc B (right column). The surface is represented using the Hammer-Aitoff projection in order to preserve the relative area of different latitude bands. The central meridian corresponds to a longitude of 180°. The substellar points are located at the longitude 0° for UV Psc A and at 180° for UV Psc B. The colour bars on the right indicate the relative surface brightness and magnetic field strength in kG for each map. Right: observed (black histogram) and best-fit spectra (red solid lines) obtained from the ZDI analysis. The spectra for different phases are offset vertically, with the phase indicated next to each spectrum.
Current usage metrics show cumulative count of Article Views (full-text article views including HTML views, PDF and ePub downloads, according to the available data) and Abstracts Views on Vision4Press platform.
Data correspond to usage on the plateform after 2015. The current usage metrics is available 48-96 hours after online publication and is updated daily on week days.
Initial download of the metrics may take a while.