Fig. 3.
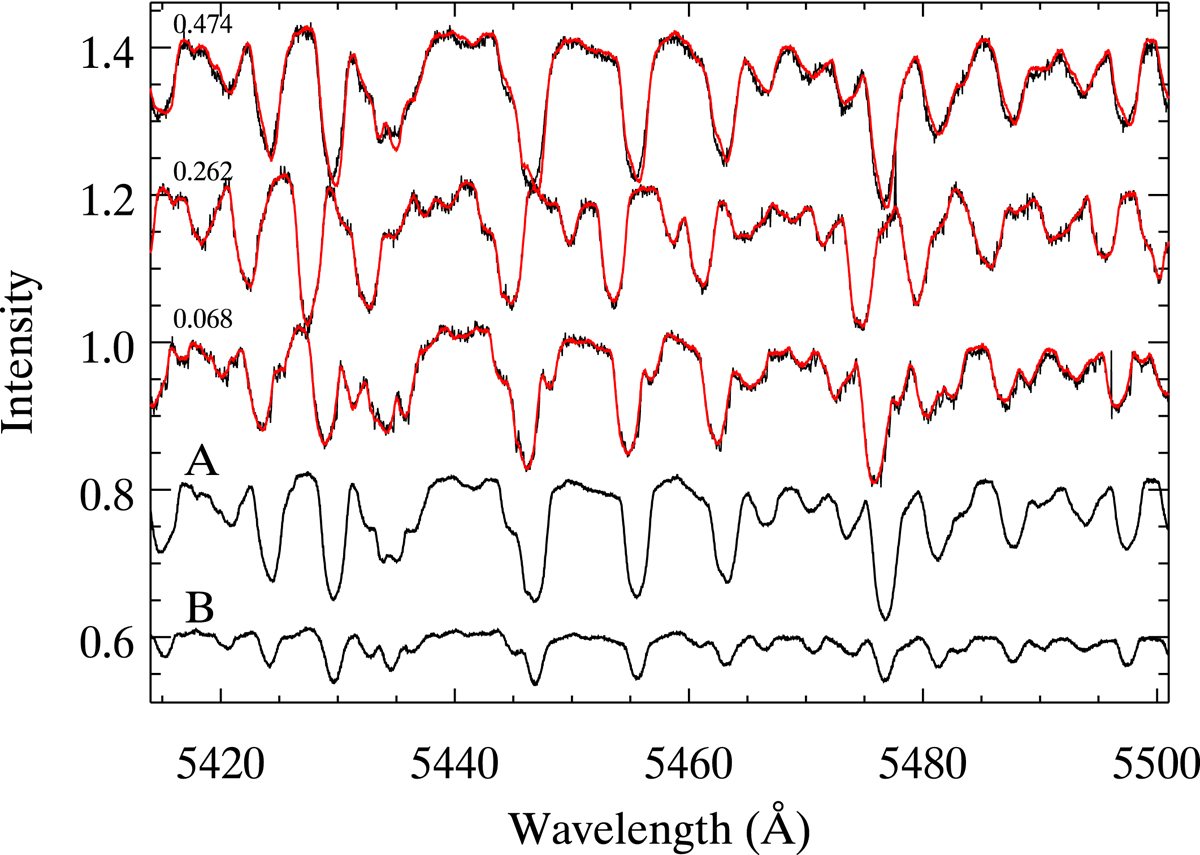
Illustration of the spectral disentangling analysis. The two bottom curves show the separated spectra for each component. These two spectra are combined into composite spectra that are compared to observations. The three top curves show this comparison for three representative orbital phases, one near each eclipse and one at furthest separation. For visibility the spectra have been shifted vertically.
Current usage metrics show cumulative count of Article Views (full-text article views including HTML views, PDF and ePub downloads, according to the available data) and Abstracts Views on Vision4Press platform.
Data correspond to usage on the plateform after 2015. The current usage metrics is available 48-96 hours after online publication and is updated daily on week days.
Initial download of the metrics may take a while.