Fig. 11.
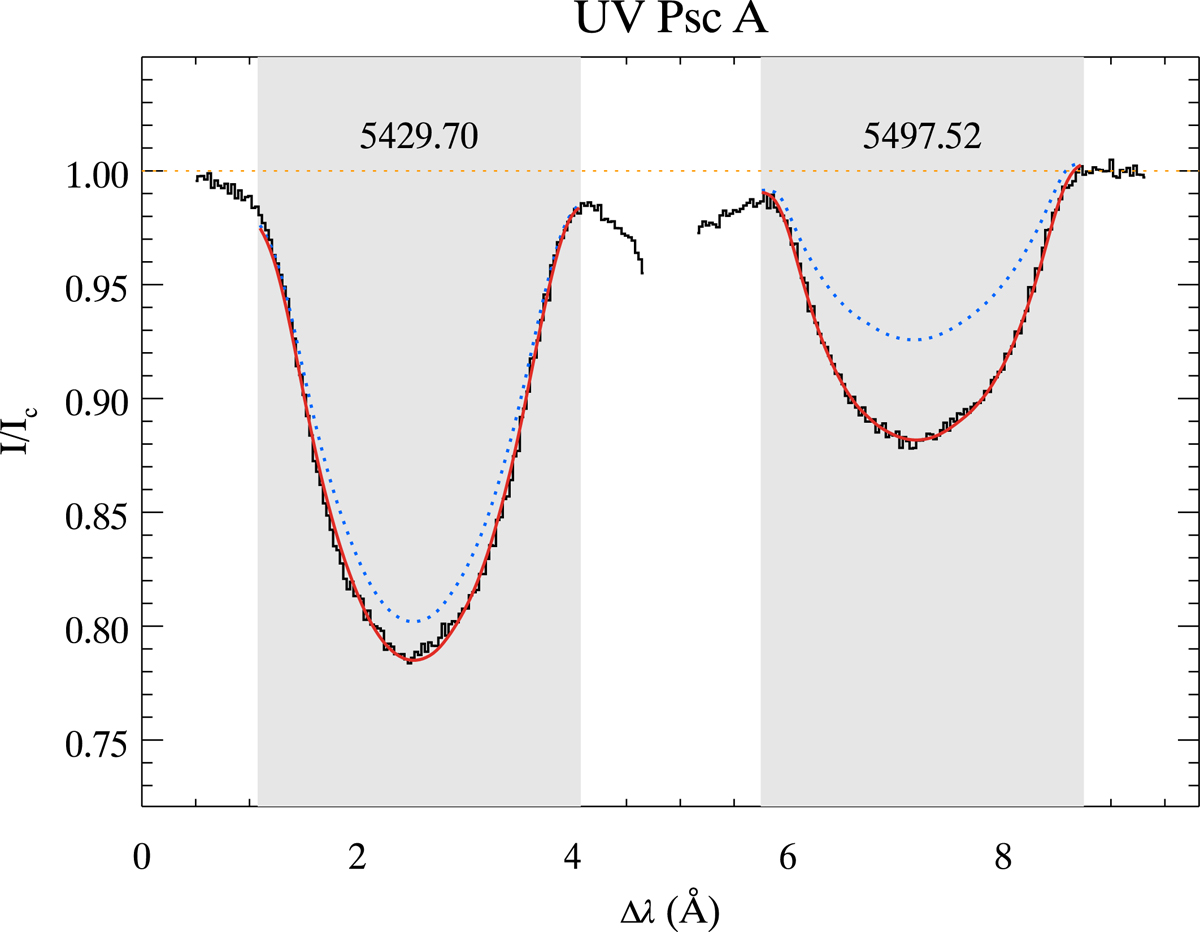
Profiles of the two Fe I spectral lines employed for inferring the magnetic field strength for UV Psc A. Observations are shown in black histograms and are compared to the median parameter fit (red solid line). The blue dotted lines correspond to the non-magnetic synthetic spectrum. The dark grey areas indicate the wavelength regions where the fitting has been carried out.
Current usage metrics show cumulative count of Article Views (full-text article views including HTML views, PDF and ePub downloads, according to the available data) and Abstracts Views on Vision4Press platform.
Data correspond to usage on the plateform after 2015. The current usage metrics is available 48-96 hours after online publication and is updated daily on week days.
Initial download of the metrics may take a while.