Fig. 10.
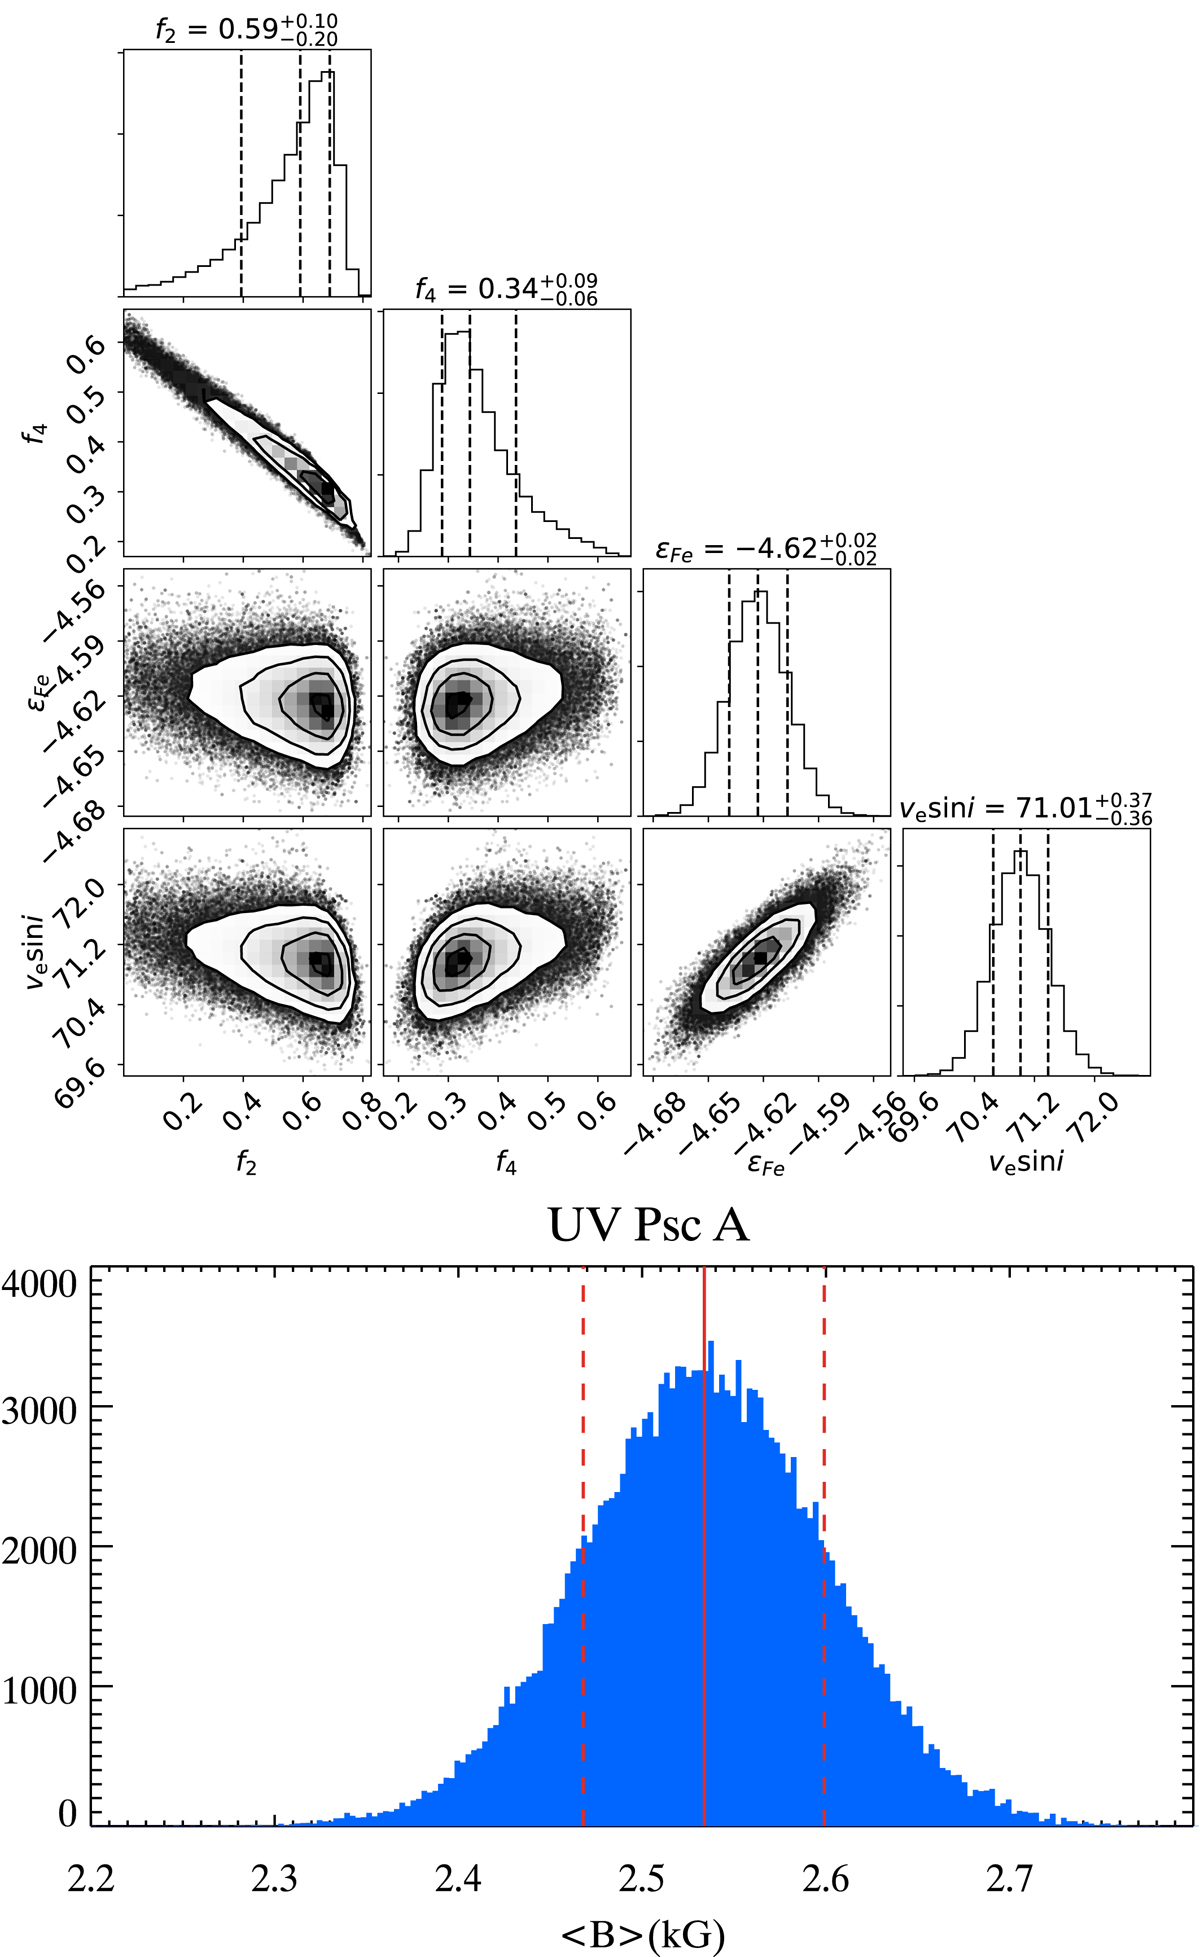
Illustration of the MCMC Zeeman intensification analysis of UV Psc A. Top: corner plot showing the posterior distribution of the model parameters (magnetic filling factors fi, abundance εFe, rotational velocity ve sin i). Bottom: posterior distribution of the resulting mean magnetic field strength plotted with its median value (red solid line) and the 1σ confidence region (red dashed lines).
Current usage metrics show cumulative count of Article Views (full-text article views including HTML views, PDF and ePub downloads, according to the available data) and Abstracts Views on Vision4Press platform.
Data correspond to usage on the plateform after 2015. The current usage metrics is available 48-96 hours after online publication and is updated daily on week days.
Initial download of the metrics may take a while.