Fig. 9.
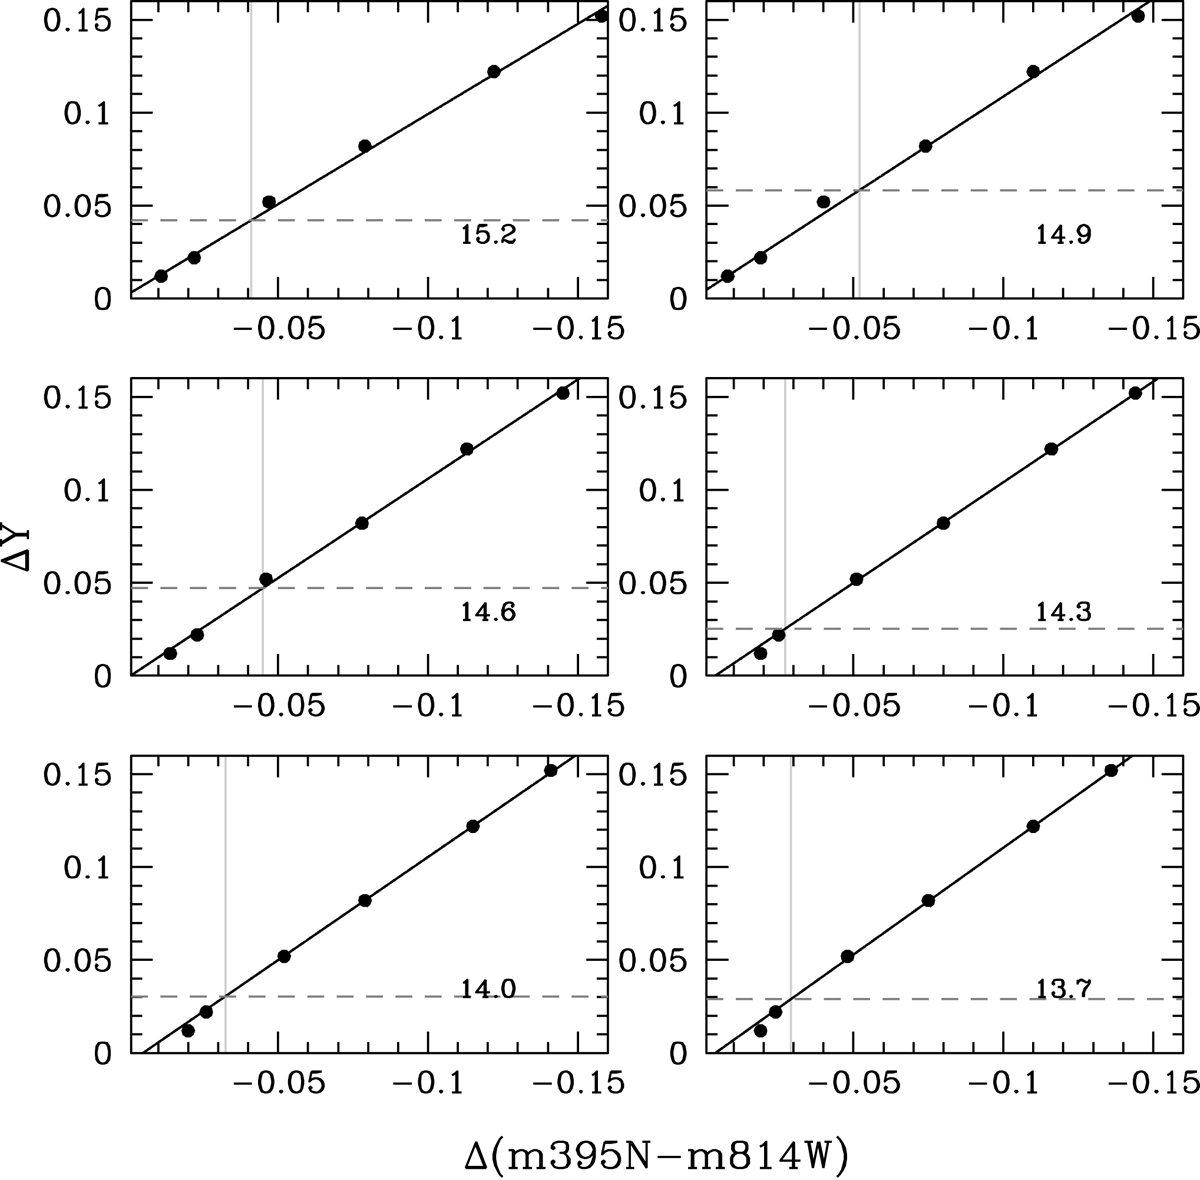
Determination of the helium mass fraction difference between 1Pe and 2Pe stars for the six magnitudes (see labels in panels) defined in Fig. 8. For each panel the filled circles are the theoretical values calculated from our isochrones and synthetic photometry. The black solid line is a linear regression to these values. The vertical gray line highlights the measured color difference between 1Pe and 2Pe fiducial lines. The horizontal dashed line indicates the corresponding Y difference read from the black solid line.
Current usage metrics show cumulative count of Article Views (full-text article views including HTML views, PDF and ePub downloads, according to the available data) and Abstracts Views on Vision4Press platform.
Data correspond to usage on the plateform after 2015. The current usage metrics is available 48-96 hours after online publication and is updated daily on week days.
Initial download of the metrics may take a while.