Fig. 8.
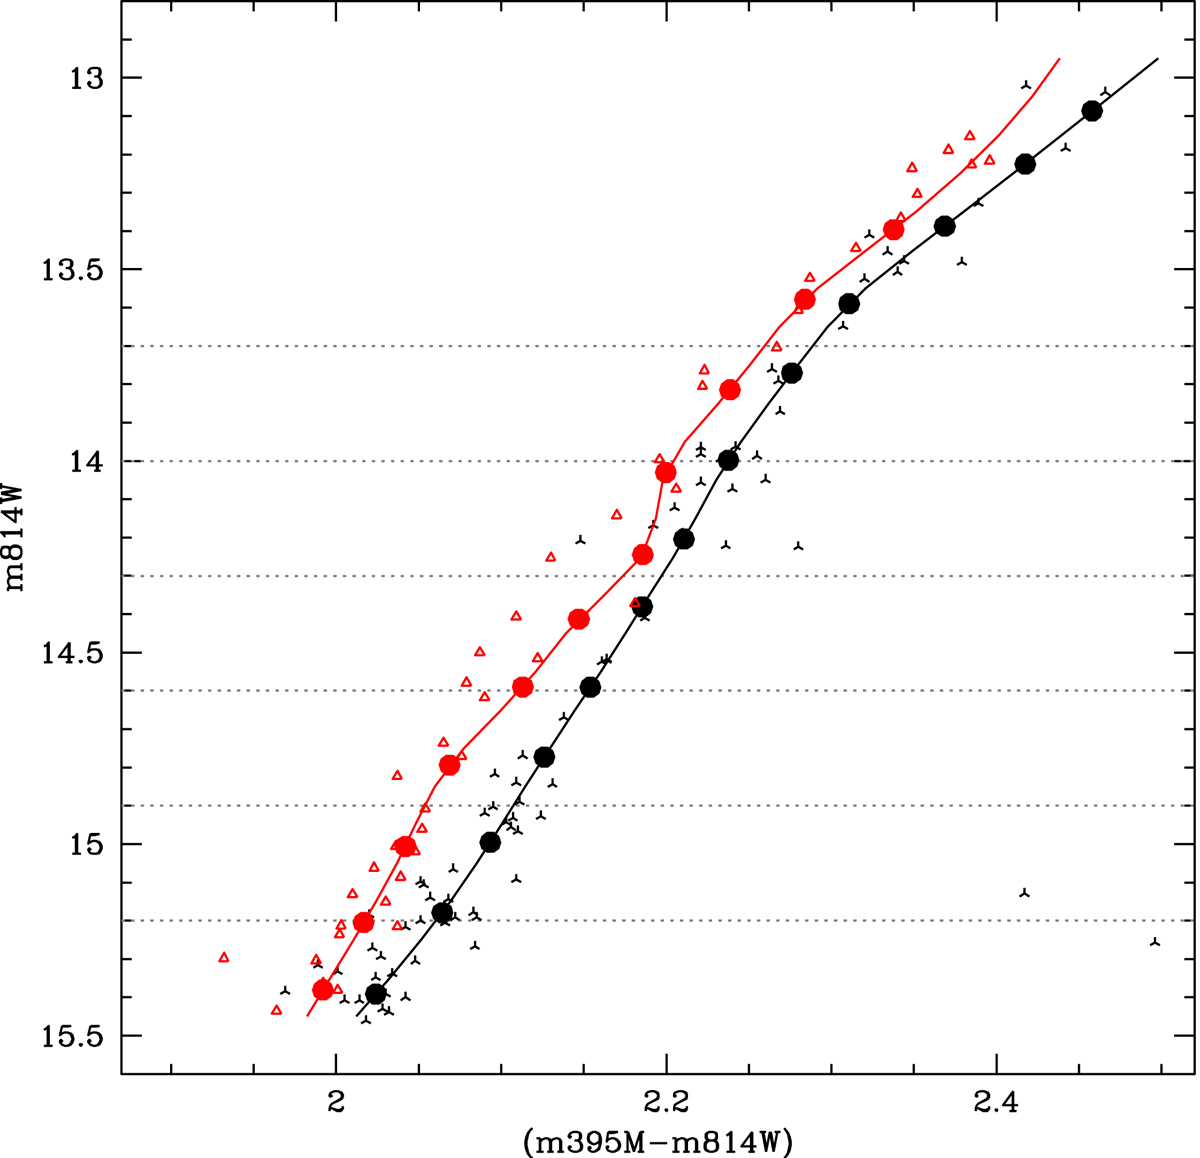
m814W versus (m395N−m814W) CMD for the 1Pe (black) and 2Pe (red) populations selected in the chromosome map of Fig. 7. The filled circles are the points used to define the fiducial lines, which themselves are shown by the solid lines. See text for details. The horizontal dotted lines indicate the m814W magnitudes at which the color difference between the 2Pe and 1Pe fiducial lines is determined.
Current usage metrics show cumulative count of Article Views (full-text article views including HTML views, PDF and ePub downloads, according to the available data) and Abstracts Views on Vision4Press platform.
Data correspond to usage on the plateform after 2015. The current usage metrics is available 48-96 hours after online publication and is updated daily on week days.
Initial download of the metrics may take a while.