Fig. 6.
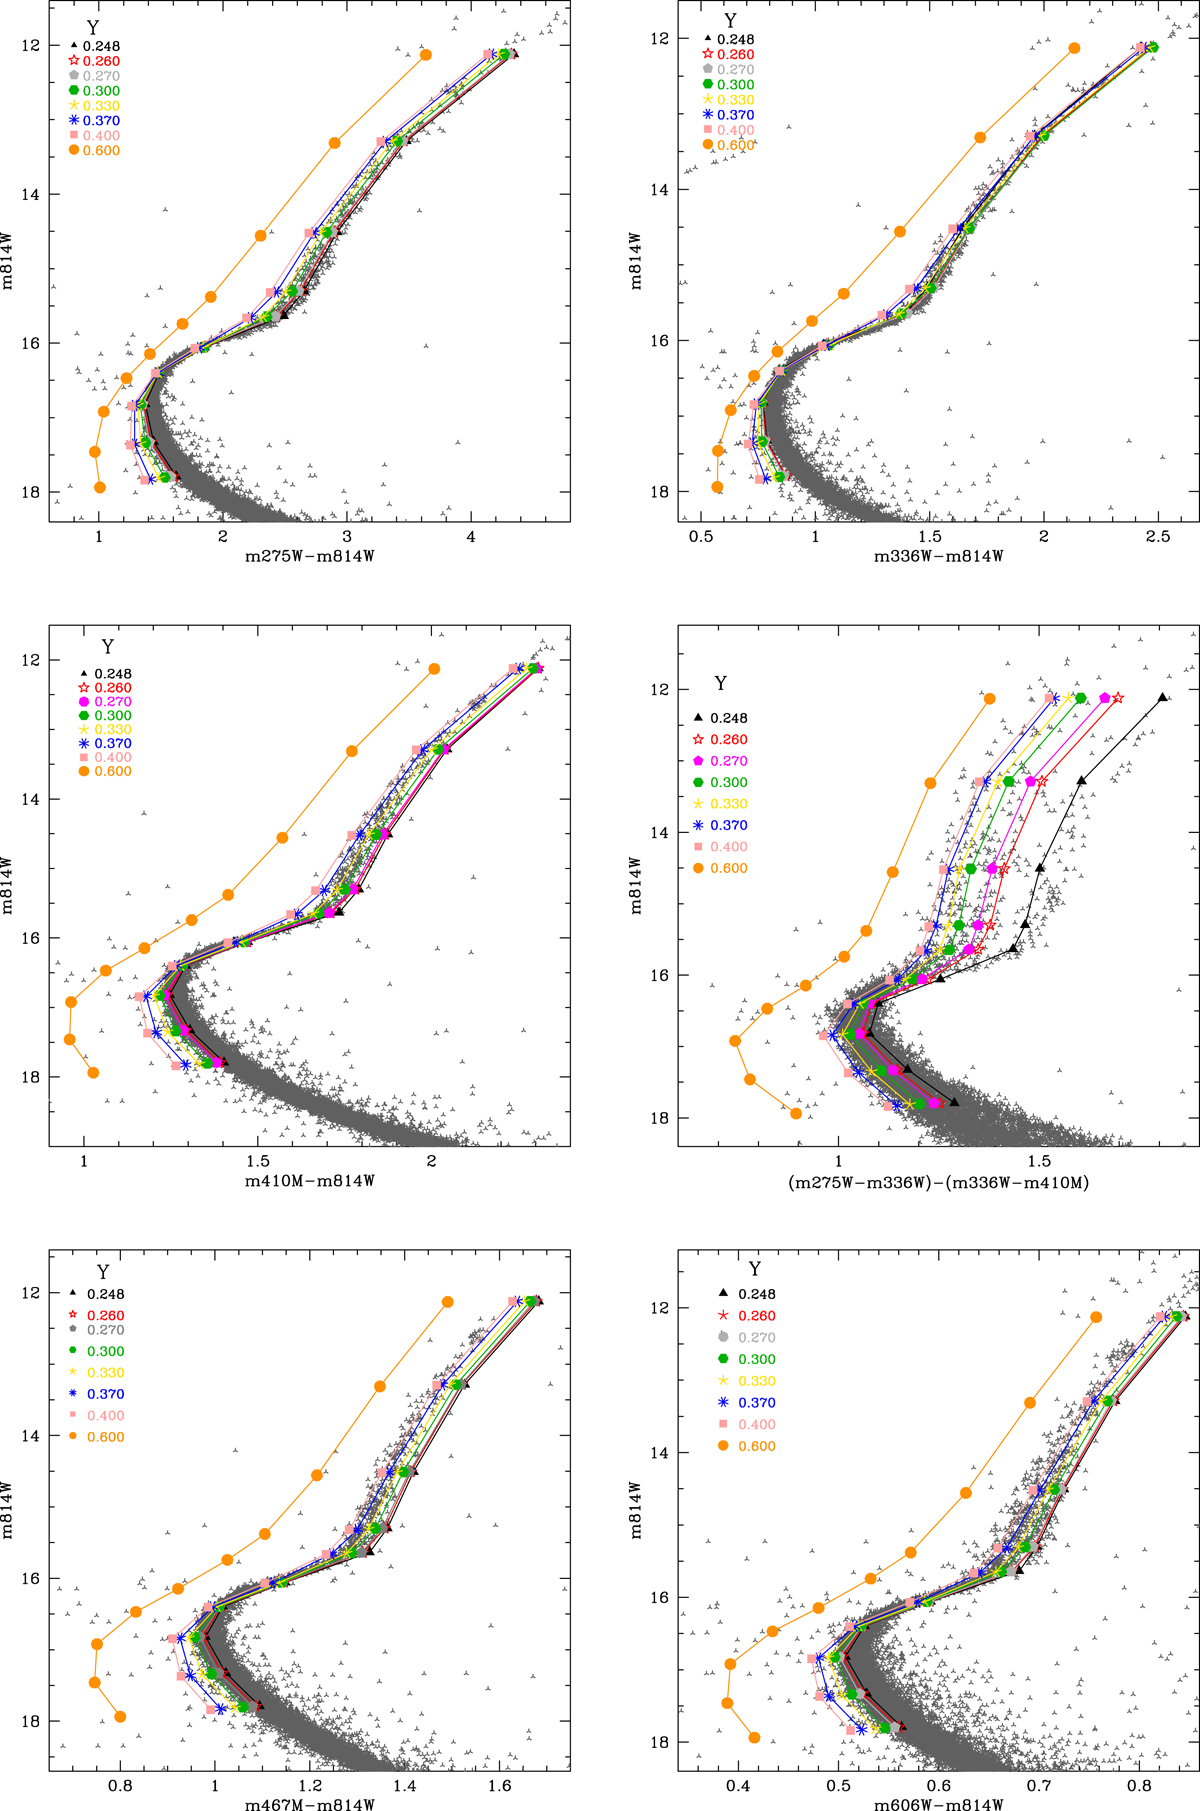
Color-magnitude diagrams: In all panels, the ordinate axis is the magnitude in the ACS F814W filter. The abscissa axis is the difference between magnitude in the X filter and the magnitude in the ACS F814W filter, where X is the WFC3 F275W filter (top left panel), WFC3 F336W filter (top right panel), WFC3 F410M filter (middle left panel), WFC3 F467M filter (bottom left panel), and ACS 606W (bottom right panel). Middle right panel: abscissa axis is the color difference (m275W−m336W)−(m336W−m410M). In all panels, different symbols and colors correspond to models with different chemical composition, tagged by their helium content (Y). Gray points correspond to the photometric data of Milone et al. (2013), except in the bottom right panel where they are from the HUGS survey (Piotto et al. 2015; Nardiello et al. 2018).
Current usage metrics show cumulative count of Article Views (full-text article views including HTML views, PDF and ePub downloads, according to the available data) and Abstracts Views on Vision4Press platform.
Data correspond to usage on the plateform after 2015. The current usage metrics is available 48-96 hours after online publication and is updated daily on week days.
Initial download of the metrics may take a while.