Fig. 3.
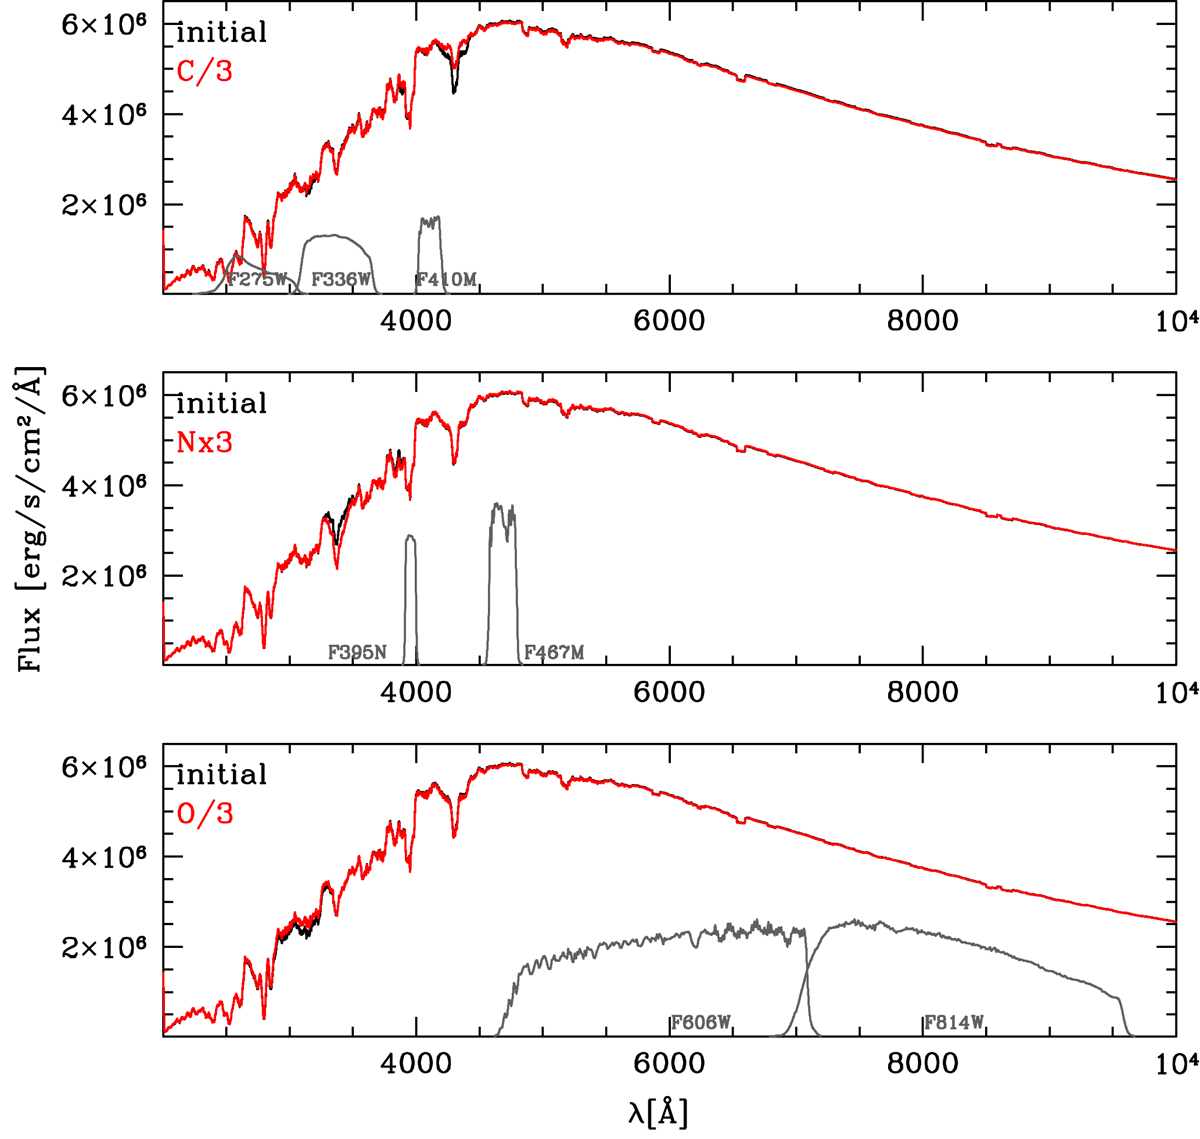
Spectral energy distribution of two models with similar parameters except the C, N, and O abundances: the red line shows a model with C/H reduced by a factor three (top panel), N/H increased by a factor three (middle), and O/H reduced by a factor three (bottom) compared to the initial model in black. The other parameters are: Teff = 5375 K, log g = 3.37, Y = 0.248. The gray solid lines indicate the transmission curves of the HST WFC3/UVIS F275W, F336W, F395N, F410M, F467M, and ACS/WFC F606W and F814W.
Current usage metrics show cumulative count of Article Views (full-text article views including HTML views, PDF and ePub downloads, according to the available data) and Abstracts Views on Vision4Press platform.
Data correspond to usage on the plateform after 2015. The current usage metrics is available 48-96 hours after online publication and is updated daily on week days.
Initial download of the metrics may take a while.