Fig. 20.
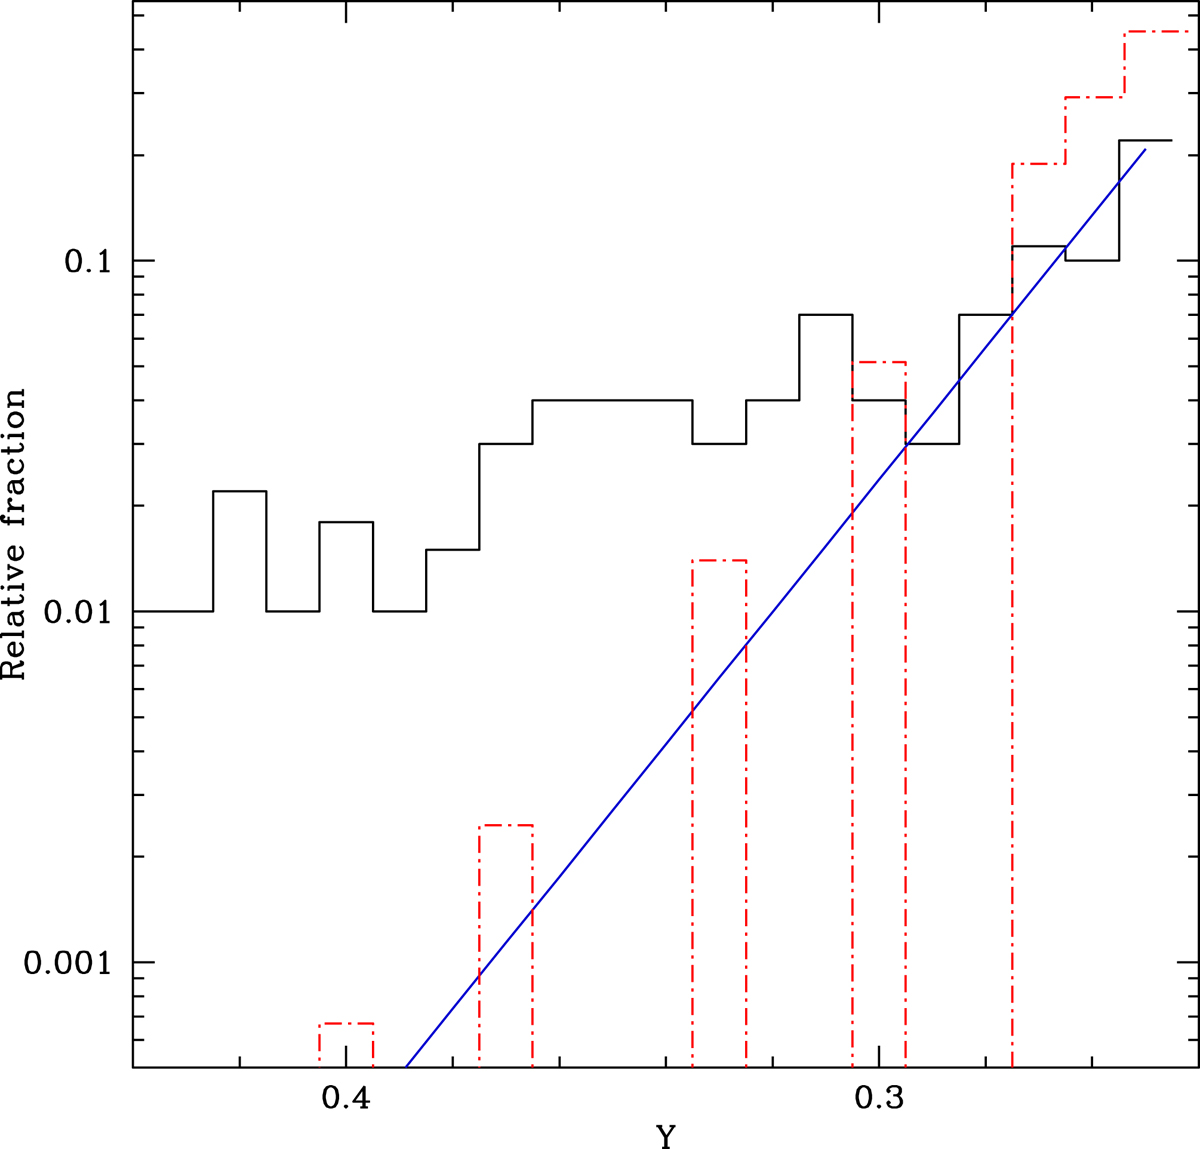
Black solid histogram: Relative fraction of stars as a function of their helium content on the lower RGB in the models of Chantereau et al. (2016) and for an age of 13 Gyr. Blue solid line: Linear interpolation of Chantereau’s distribution between Y = 0.248 and 0.290, and extrapolation up to Y = 0.400. Red dashed histogram: Adopted distribution based on the previous interpolation and re-scaling so that the sum of relative fractions is equal to 1.
Current usage metrics show cumulative count of Article Views (full-text article views including HTML views, PDF and ePub downloads, according to the available data) and Abstracts Views on Vision4Press platform.
Data correspond to usage on the plateform after 2015. The current usage metrics is available 48-96 hours after online publication and is updated daily on week days.
Initial download of the metrics may take a while.