Open Access
Fig. 17.
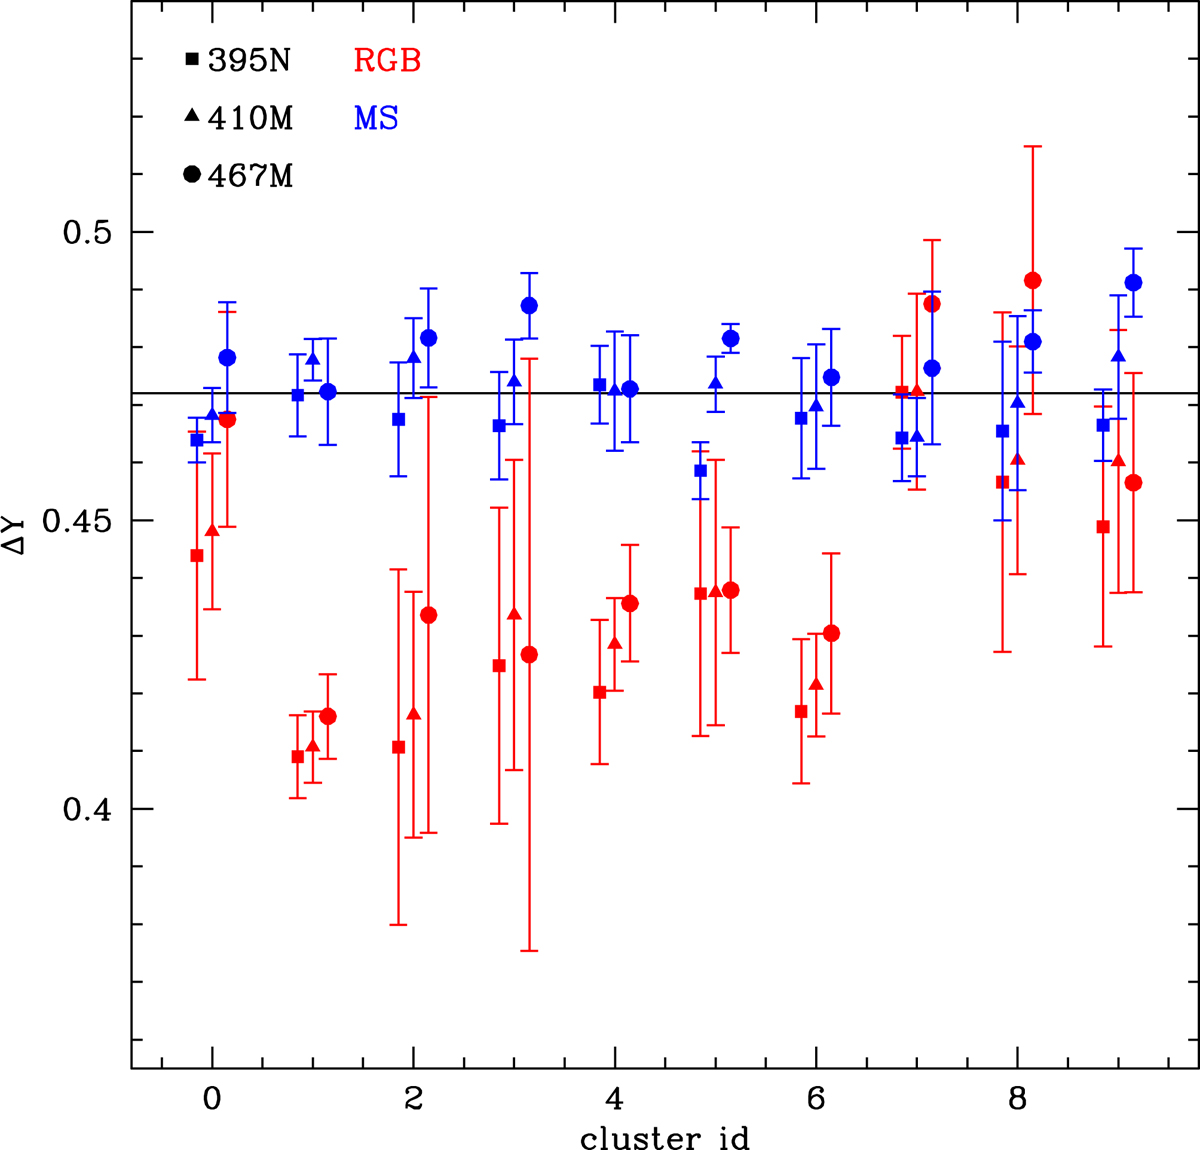
Maximum helium difference ΔY for ten synthetic clusters. Different symbols refer to different colors used for the determination. Blue (red) symbols stand for stars on the MS (RGB). The horizontal black solid line shows the true helium difference used to build the clusters.
Current usage metrics show cumulative count of Article Views (full-text article views including HTML views, PDF and ePub downloads, according to the available data) and Abstracts Views on Vision4Press platform.
Data correspond to usage on the plateform after 2015. The current usage metrics is available 48-96 hours after online publication and is updated daily on week days.
Initial download of the metrics may take a while.