Fig. 1.
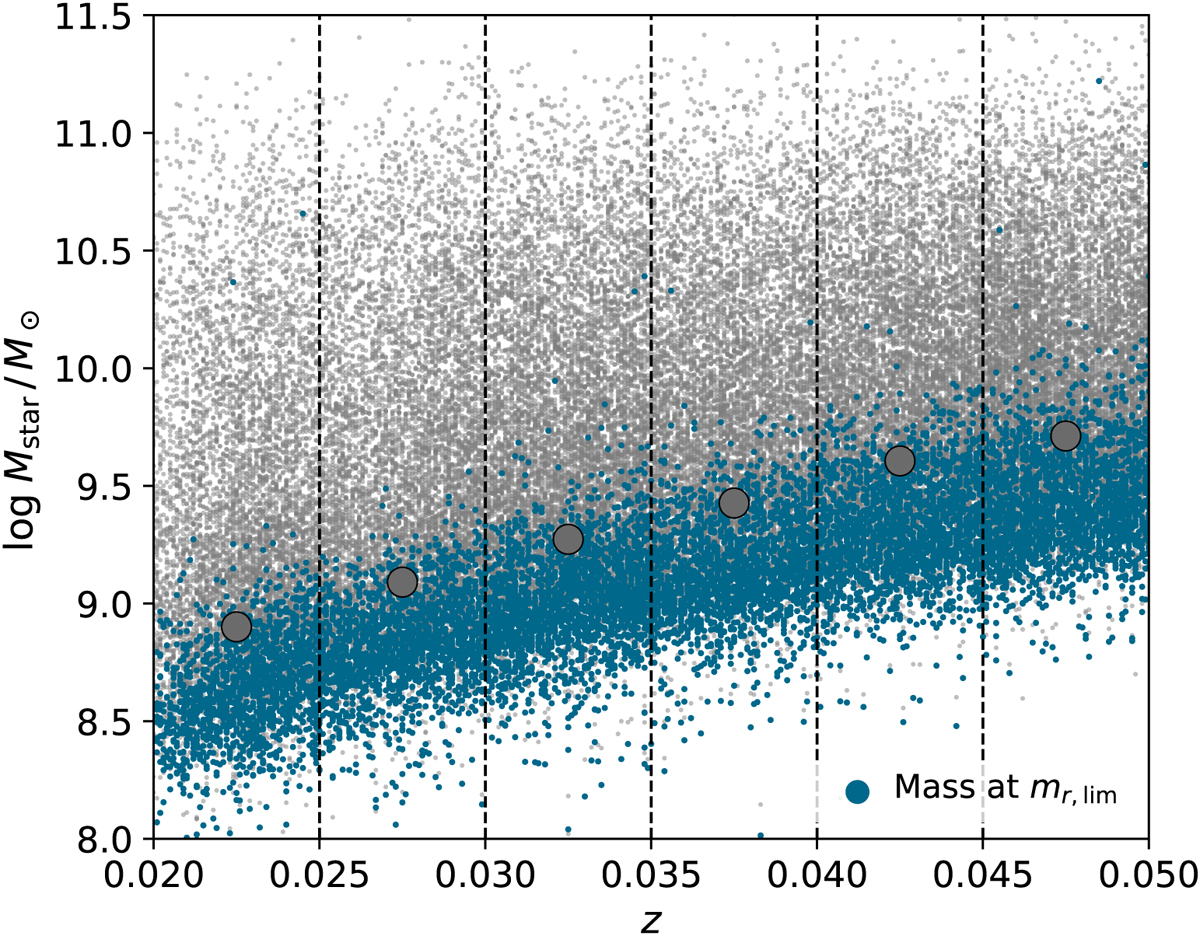
Stellar mass versus redshift for star-forming galaxies in GSWLC-2 (Salim et al. 2016, 2018) with z < 0.05. Blue points show the limiting stellar mass value for the faintest 20% of galaxies in each redshift bin and large circles show the stellar mass completeness limits as a function of redshift.
Current usage metrics show cumulative count of Article Views (full-text article views including HTML views, PDF and ePub downloads, according to the available data) and Abstracts Views on Vision4Press platform.
Data correspond to usage on the plateform after 2015. The current usage metrics is available 48-96 hours after online publication and is updated daily on week days.
Initial download of the metrics may take a while.